
OrgPlus RealTime Views
Organizational Charting
Redesign views to incorporate a simplified user-friendly experience that will accommodate both admin and average user.
Services
UX Design
Interface Design
UX Consulting
Field
Org Charting
Type
Web Application
The Objective
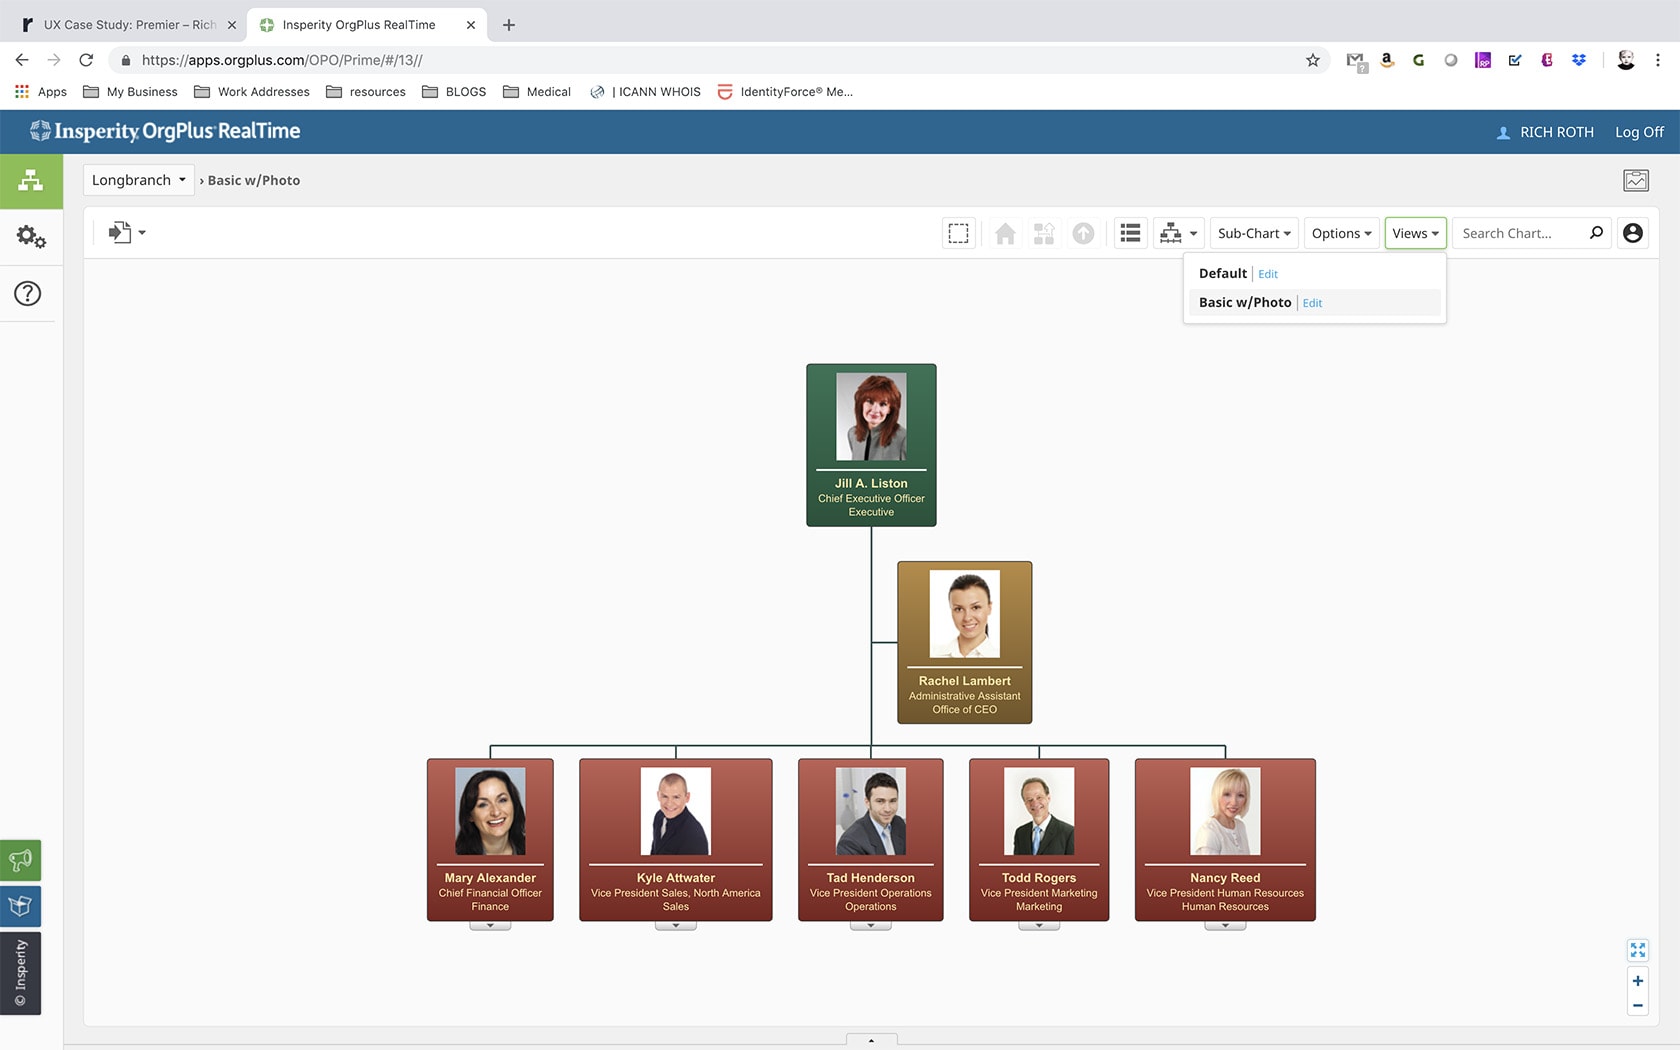
OrgPlus RealTimes Views are a powerful feature that allows users to customize their charts visual appearance from a style and data standpoint. Whatever you imagine can be built using views. However the tool is heavily underutilized because of it’s complexity and inconsistent behavior. UX’s core job is to reimagine the feature and simplify view creation/editing functionality. By doing this we hope to help users understand and utilize the tool’s full capabilities.
My Approach
OrgPlus RealTime helps small businesses, divisions or departments build and present their organizational framework. Users can customize the visual appearance and data displayed in their org chart by utilizing the tools ‘Views’ function. OrgPlus RealTime would like to redesign the tool’s ‘Views section’ to incorporate a simplified user-friendly experience that will accommodate both the admin and the average user.
Here’s how I did it
01: Empathize: Understand the project, it’s goals, drivers, and scope
- Met with two stakeholders to get an understanding of what the project was and where it needed to be.
- Created a creative brief defining the project
- Defined metrics
Empathy Statement:
Deliverables:
Stakeholder Interviews
Creative Brief
Tools Used:
Pen & Paper
MS Word
Basecamp
02: Discover & Define: Understand the product/service and its users in depth.
- OrgPlus RealTime is a sophisticated application that offers various solutions through a variety of means. To utilze the tool and unlock it’s true potential, some training and knowledge of organizational structure is needed.
- I interviewed and shadowed four end users discussing their current usage and knowledge of setting up views.
- Patterns were brought to light of how users interacted with the feature: what they used, didn’t use, and what was lacking.
- Scenarios created touching on section features.
Scenarios:
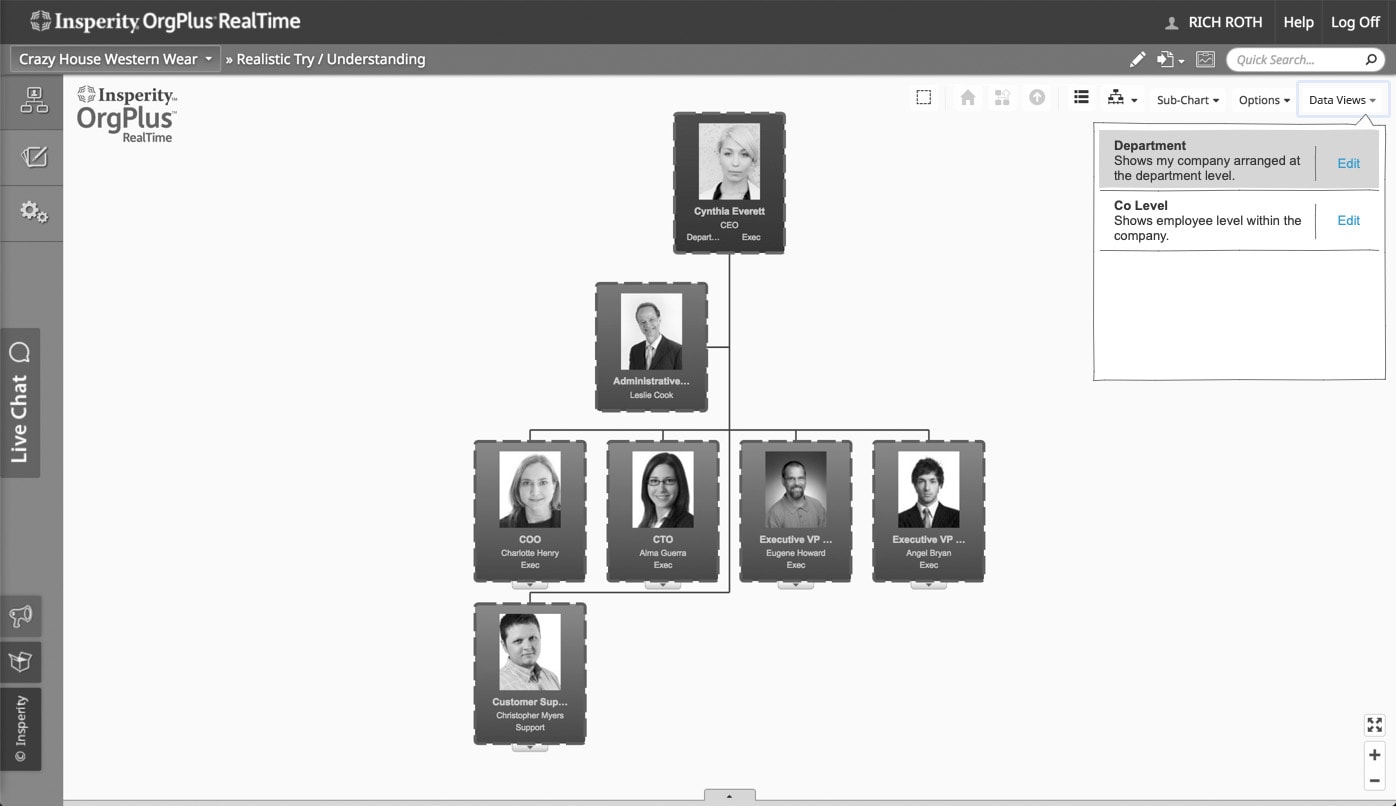
You are the Operations Director for an ad agency called “Sterling Cooper”. Along with being a director, you’re also responsible for maintaining the company’s org chart. You have set up two versions (views) of the company’s chart: one organized by department and another organized by level within the company.
Scenario 1:
Sterling Cooper has given each employee a company cell phone. You want to add each employee’s new number to the org chart. You’ve already updated and imported your data source into OrgPlus. How would you add the new numbers to Sterling Cooper’s chart using OrgPlus?
Scenario 2:
Sterling Cooper currently shows its employees’ personal and company phone numbers on its org chart. Many employees have complained about receiving phone calls to their personal numbers, so you want to remove this field. How would you do this using OrgPlus?
Scenario 3:
Some of your employees have notified you they haven’t been issued a company phone yet. Instead of asking the entire company who hasn’t been issued their company phones, you want to see within the org chart who doesn’t have a company phone number listed. How would you do this within OrgPlus?
Scenario 4:
Sterling Cooper has just expanded to include a marketing department. How would you distinguish this new department from the others in your org chart within OrgPlus?
Scenario 5:
Sterling Cooper’s new marketing department recently rebranded the company. You are so excited about the new color scheme that you decide to apply it to the org chart. How would you update your chart within OrgPlus to reflect the new colors orange (#cf7633) and beige (#d9c590)?
Scenario 5:
Your HR administrator set up a new marketing manager role for the new marketing team. You need to give the marketing manager access to see the departmental view of the org chart. How would you do this within OrgPlus?
Deliverables:
Discovery/Research of Current Platform
- Usage stats, what’s working, what’s lacking, what’s needed
End User Interviews
Competitive Analysis
Analysis of Research
User Testing Scenarios
Tools Used:
Pen & Paper
MS Word
MS Excel
Internet Browser
SilverBack App
Basecamp
03: Ideate: Understand the most important problems and opportunities. Identify potential solution ideas to begin testing with
- Identify workflows and create scenarios.
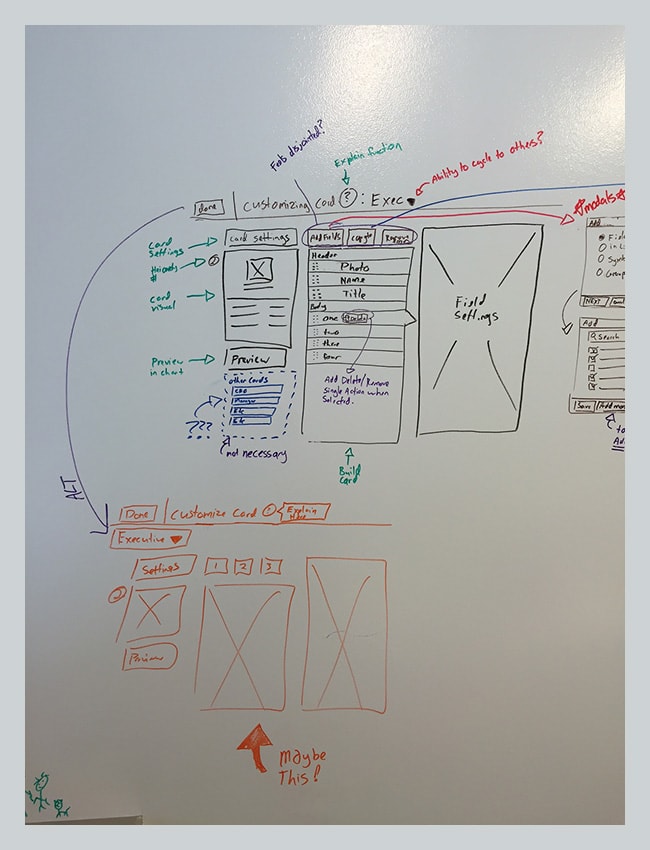
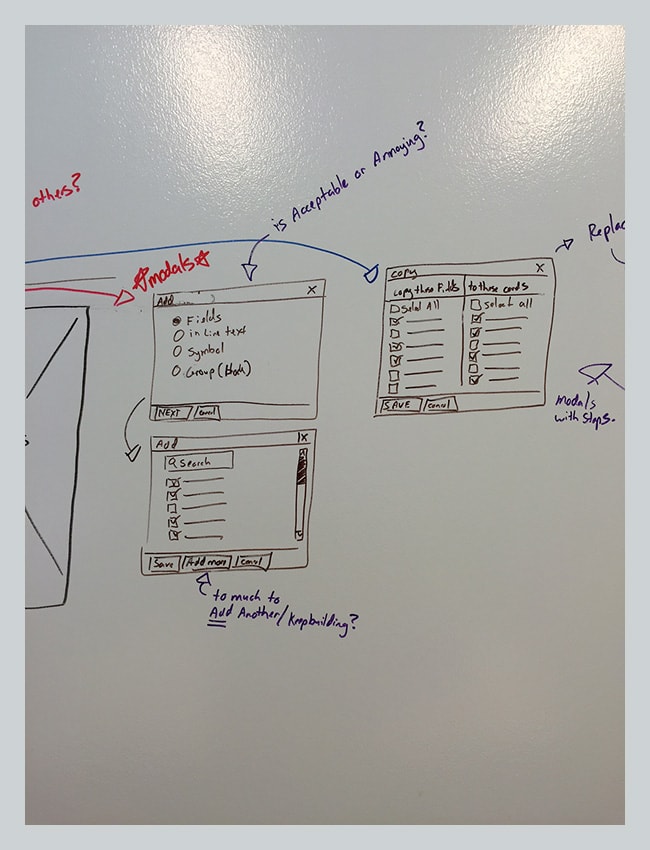
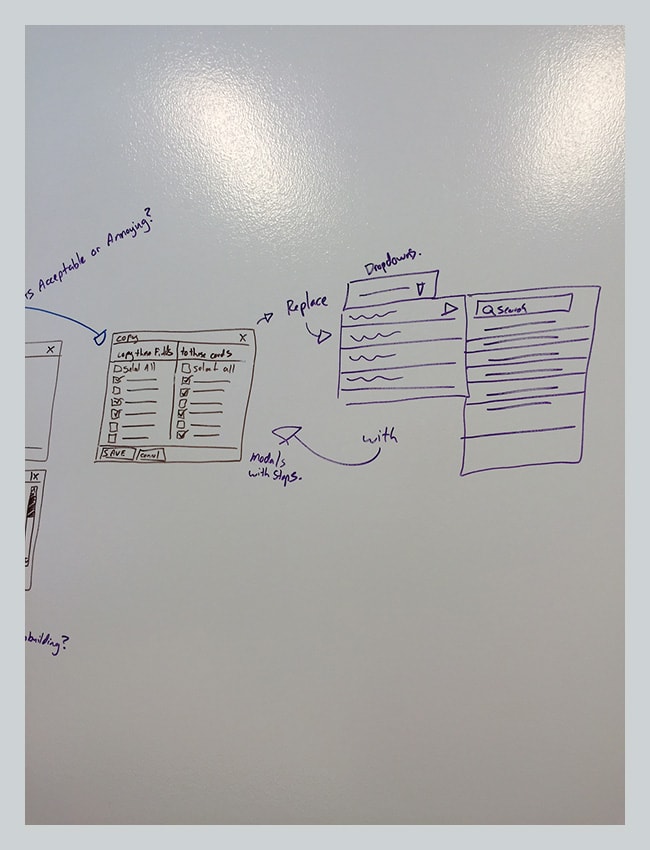
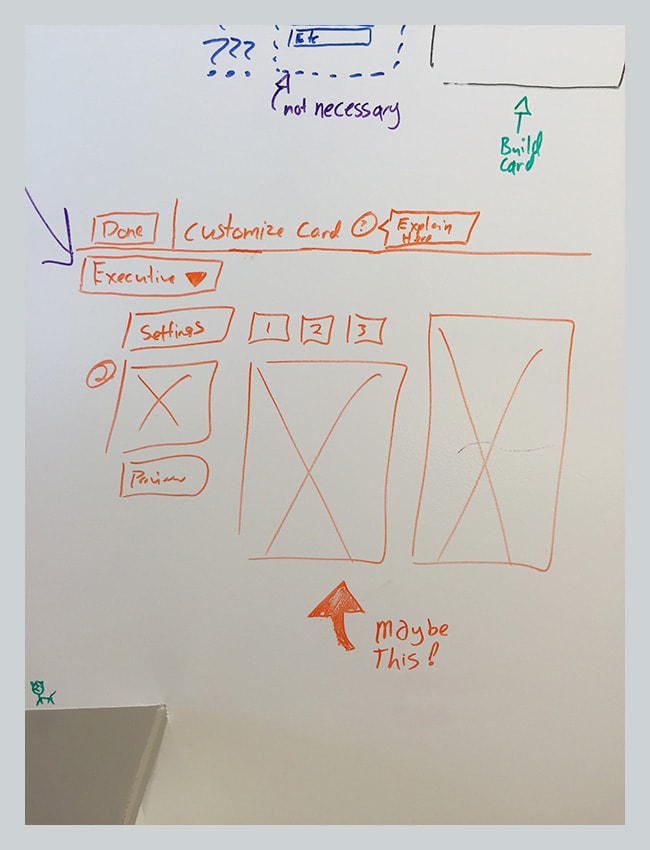
- Begin to sketch solutions
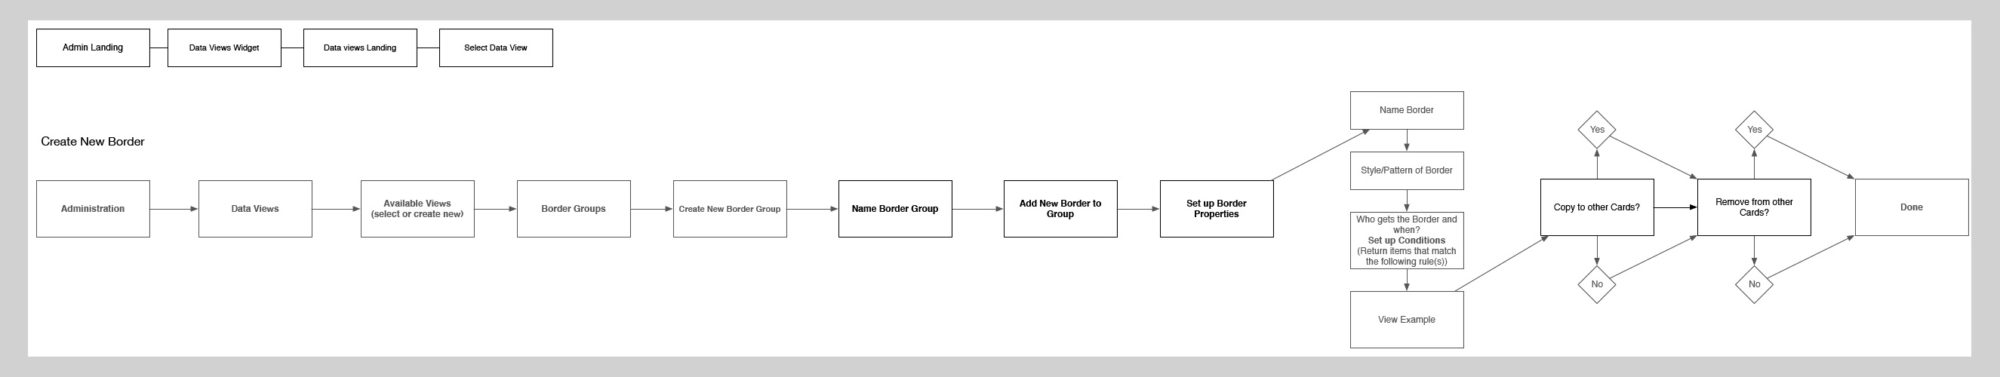
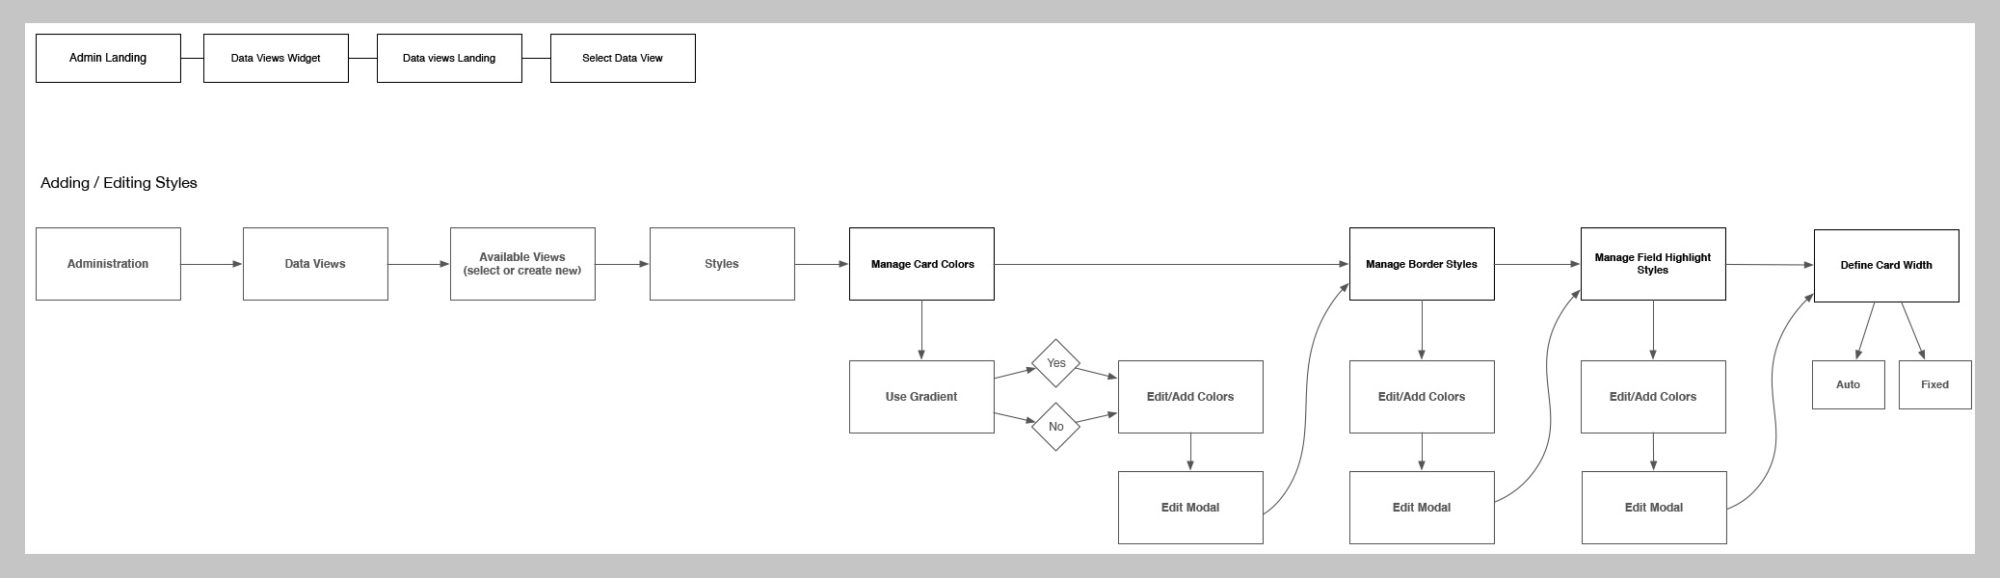
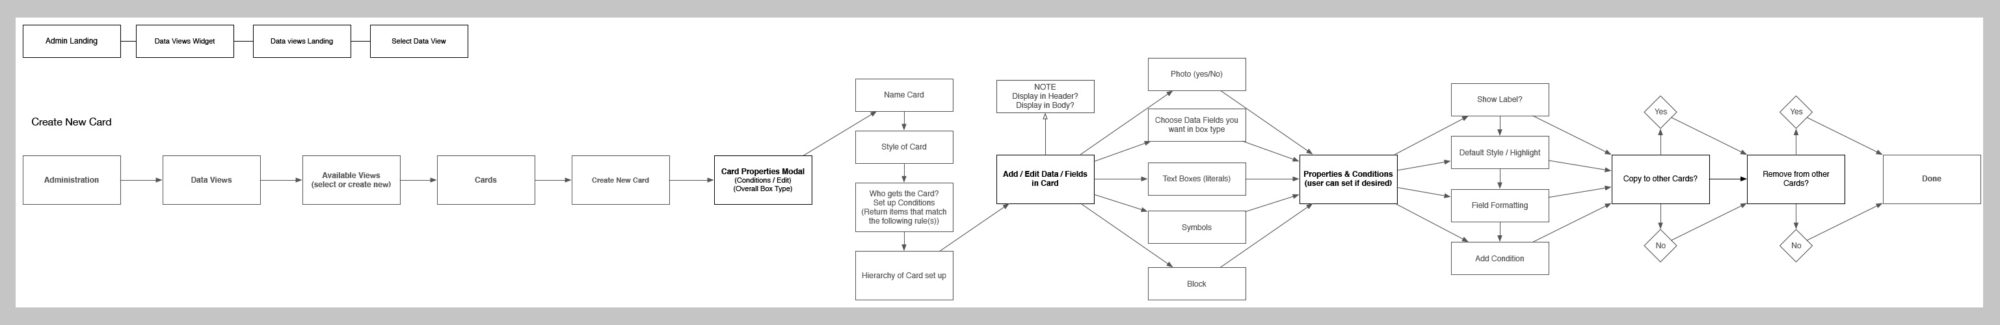
Workflows:
Sketches:
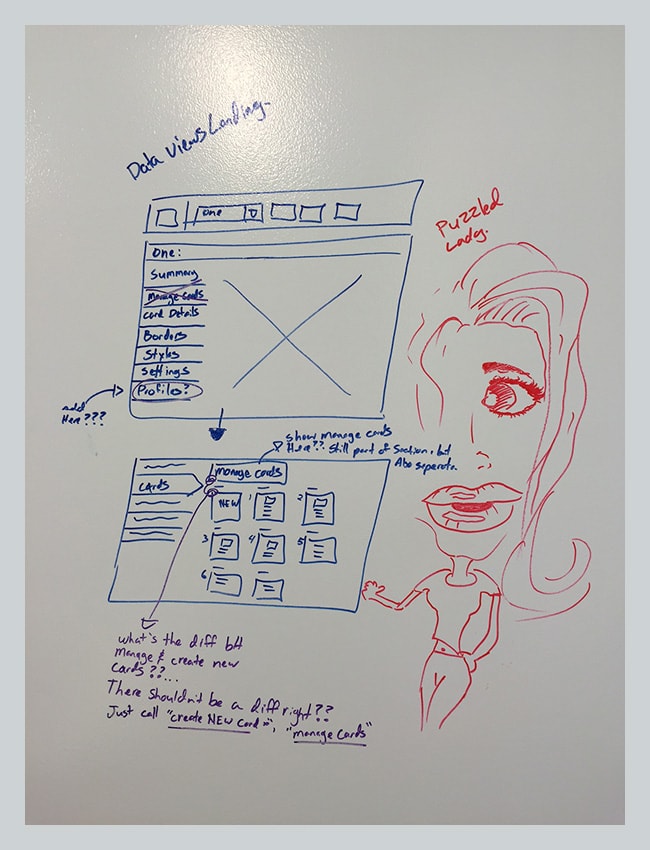
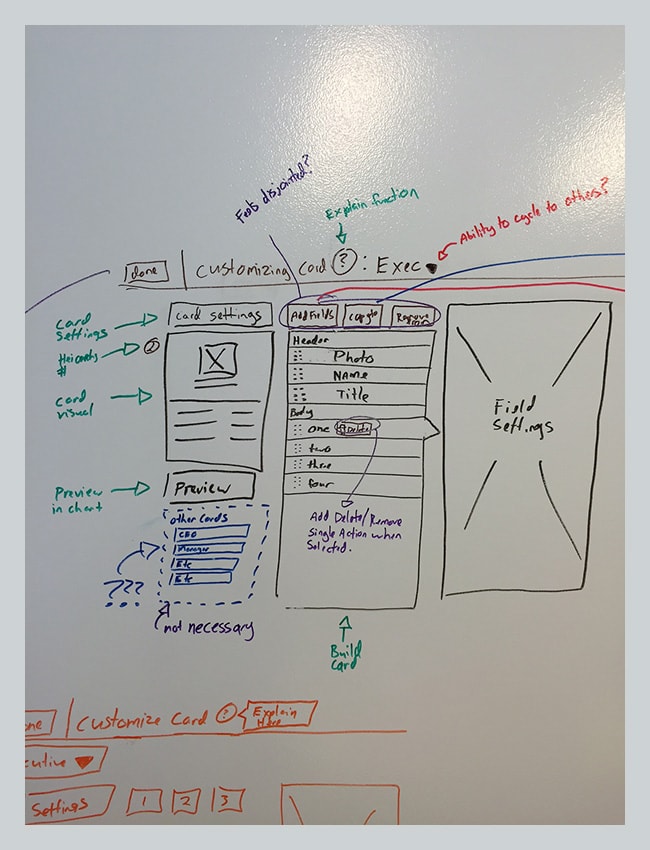
Deliverables:
Task Specific Workflows
Loose Sketches
Tools Used:
White Board
Omnigraphle
Basecamp
04: Prototype & Test: User validated, functional prototype that fulfills prioritized needs and opportunities.
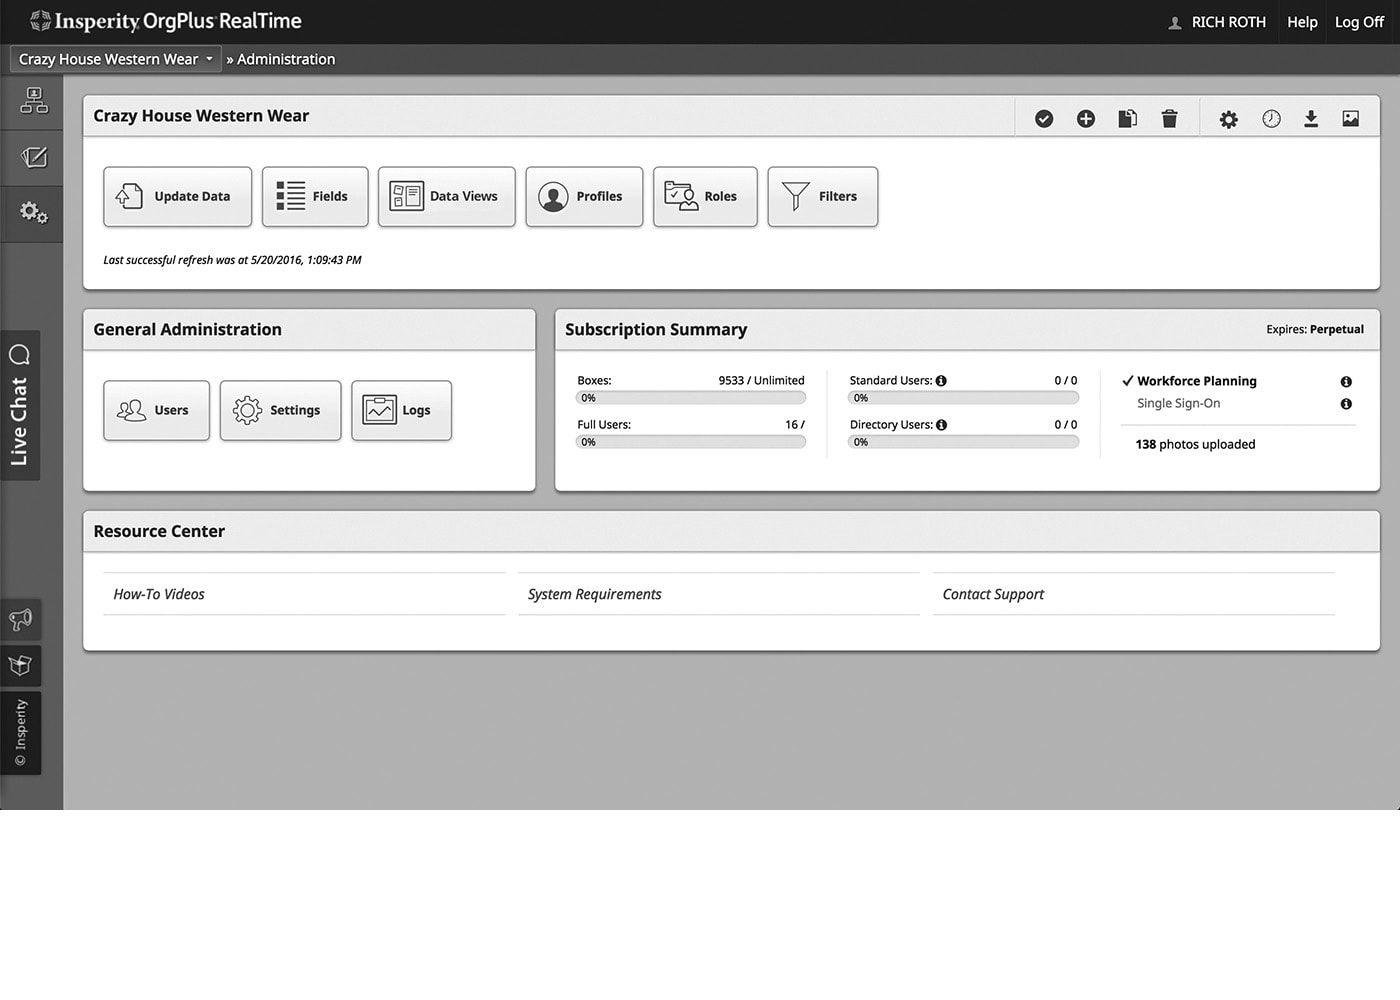
- High fidelity prototypes based off of specific workflows were built and tested in an iterative fashion until consistency was achieved.
- Thirteen users tested
- Goal: Allow users to create and/or edit a view and have it display as expected
High Fidelity Prototypes:
Deliverables:
Wireframes
Interactive Prototype
User Testing results
Tools Used:
Pen & Paper
MS Word
Axure RP
SilverBack App
Validately.com
Basecamp
05: Recommendations: Delivery of completed requirements and all other necessary documentation
- Testing results summarized
- Key areas to focus on, as well as areas to trim down presented to stakeholders and development.
Recommendations:
Workspace:
- Rename ‘Views’ to ‘Data Views’
- Add ‘Edit’ link next to each data view, clicking deep links you to summary for each
- Control Panel Legend: Add ‘Edit’ Link next to each defined Card and Border Stack
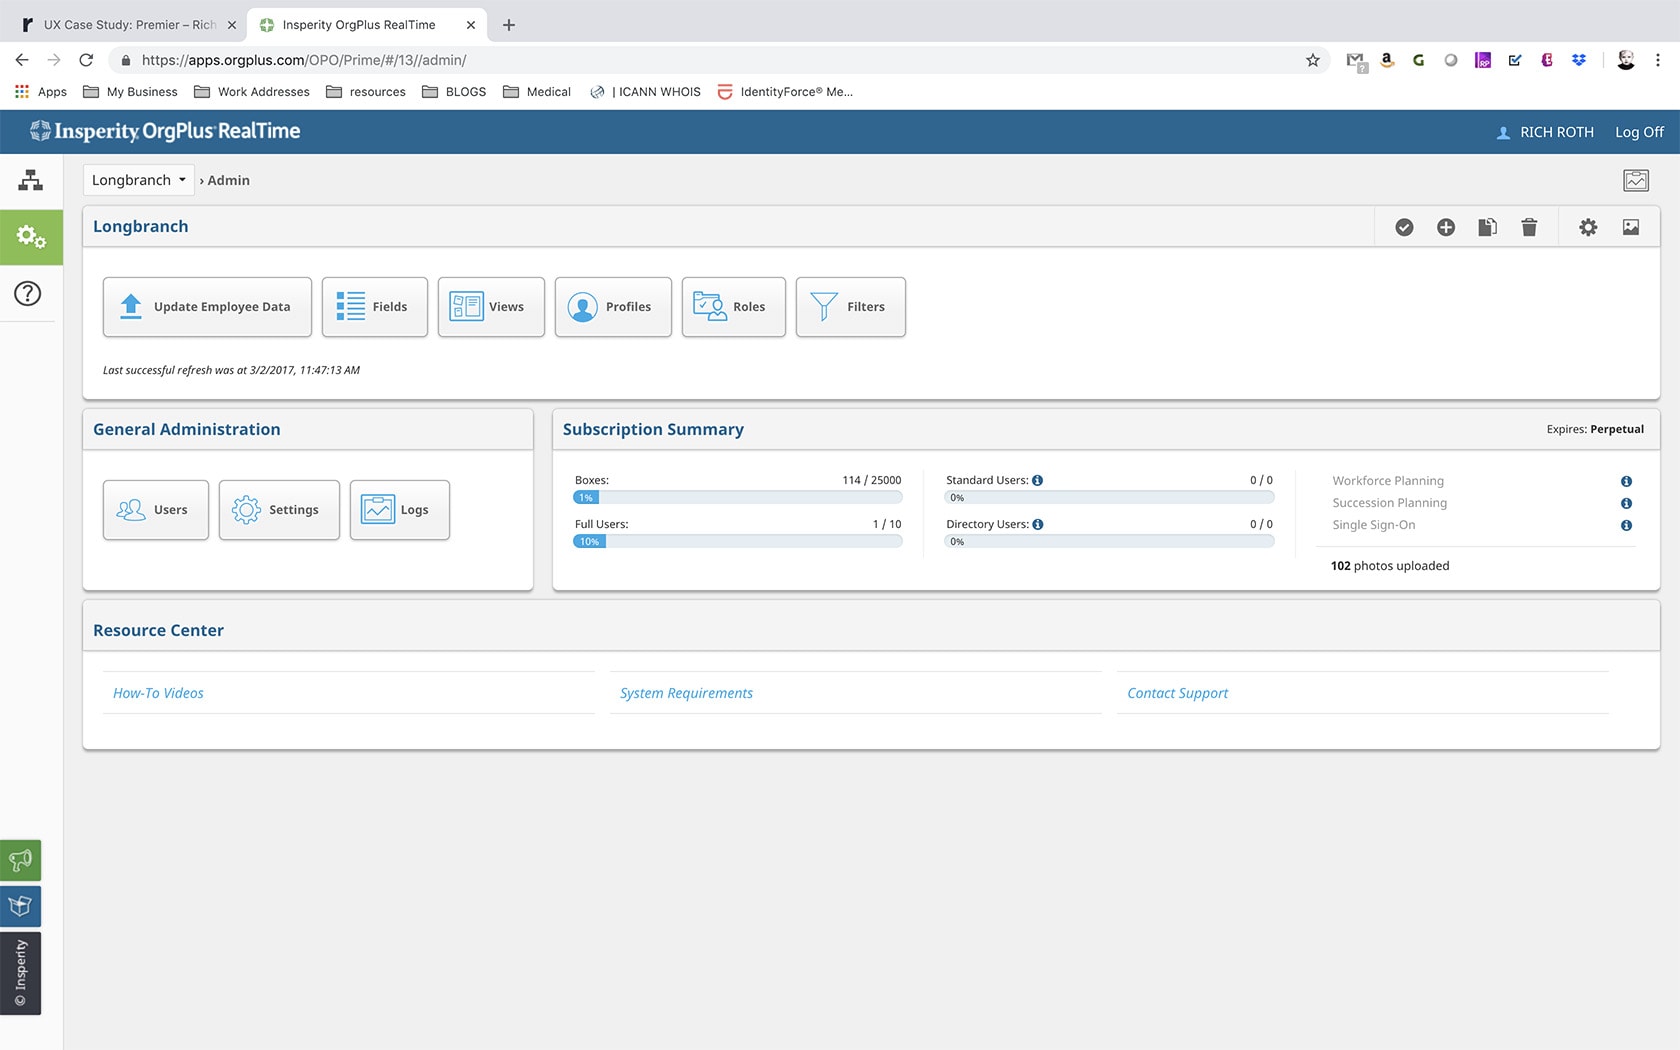
Admin:
- Rename ‘Views’ widget to ‘Data Views’
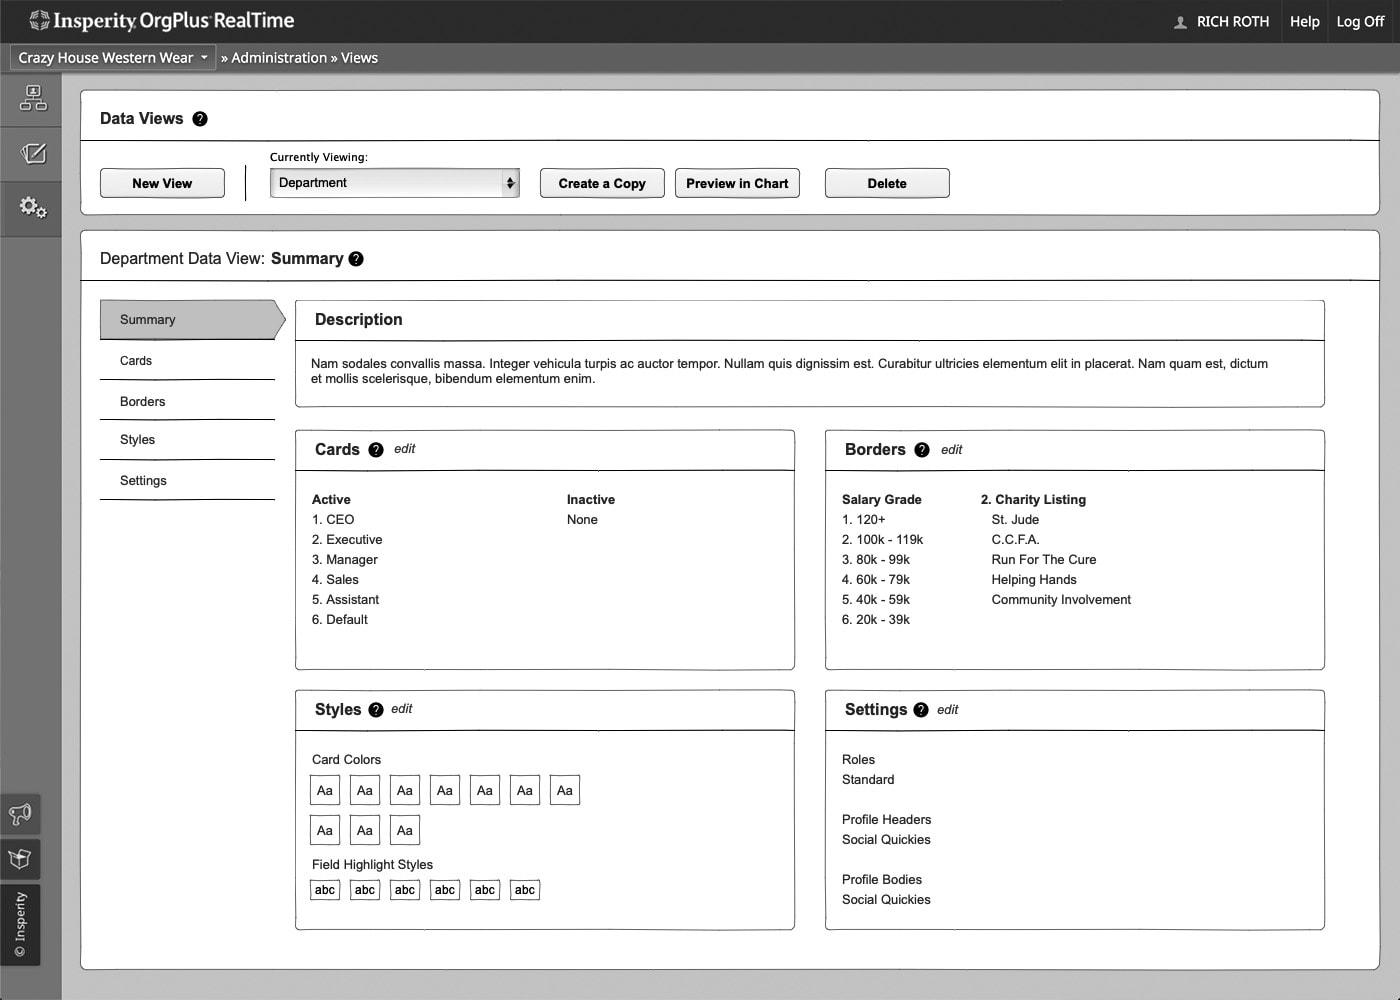
Data Views Section
- Add ‘Done’ button at the top left of each page/section to go back (currently done is at the bottom left)
- Remove explanation text for ‘Data Views’ and place within a tool tip to the right of the title
- Start with the Summary upon entry
- Add tool tips by each widget Header
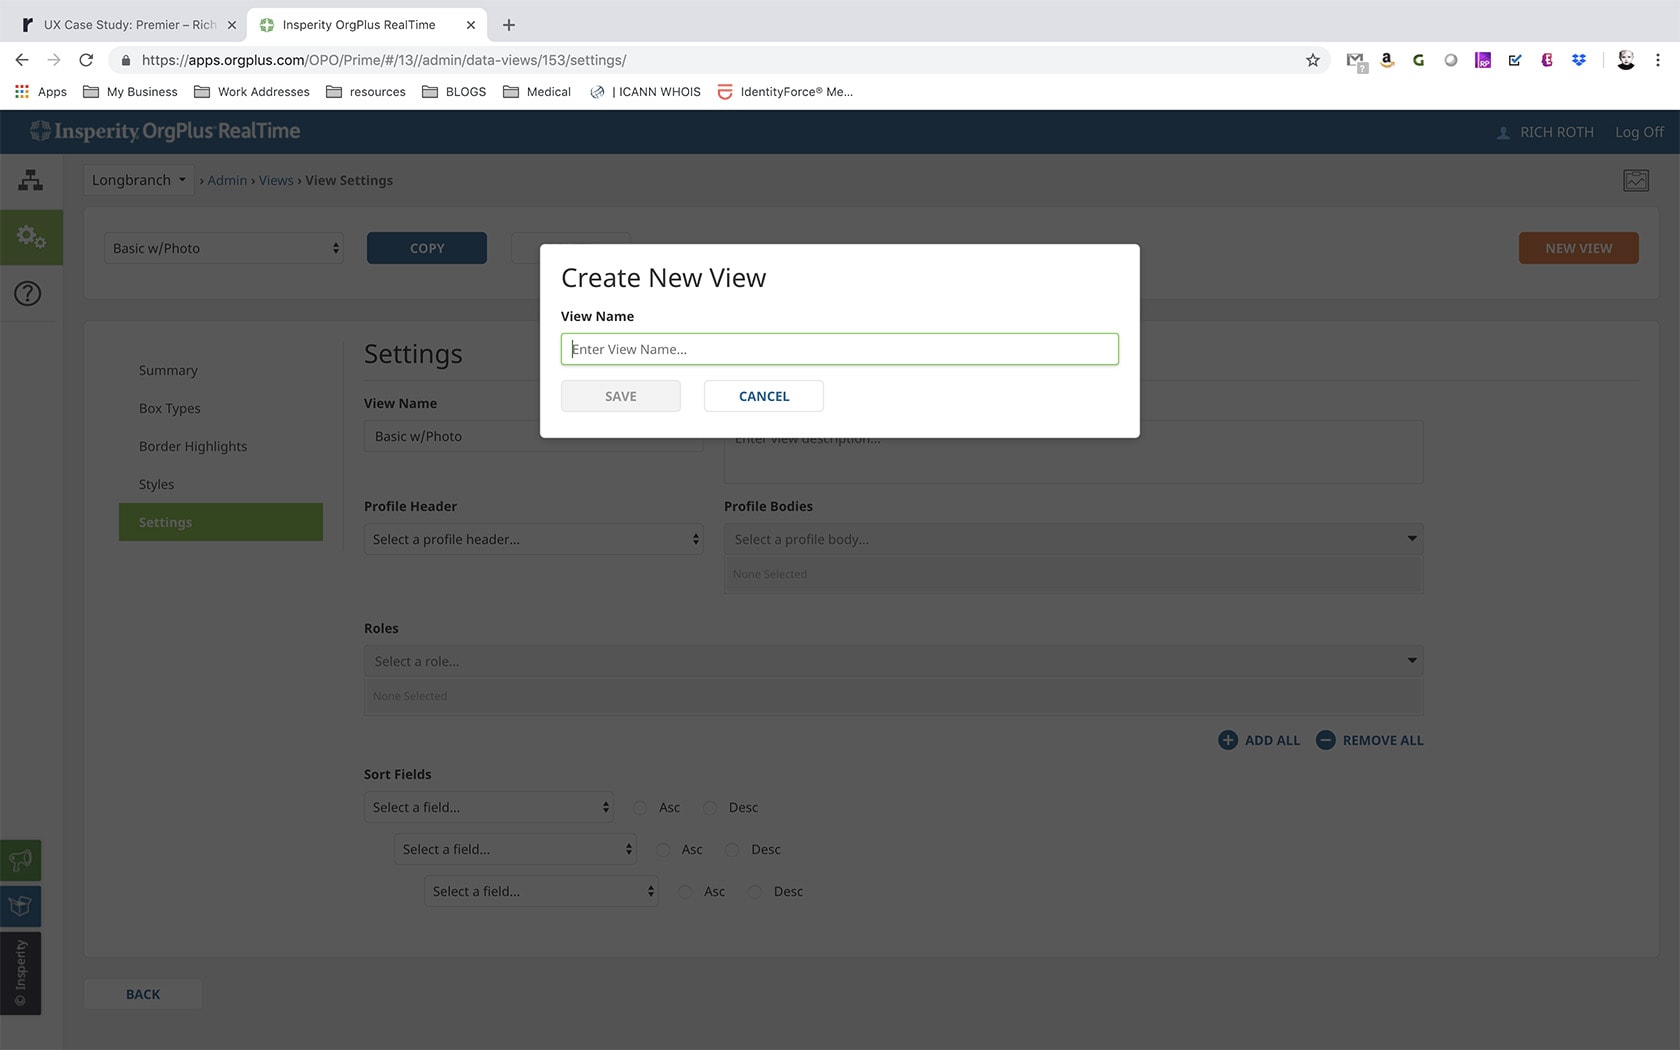
- Reorganize buttons in Data Views selection widget
- New View
- View drop down
- Create a Copy
- Preview in Chart
- Delete
- Give ability to Edit/click into each section from widget
Selected View
- Place View Name in view Widget
- Example: View Name Data View: Summary
- Logically Order Left Navigation
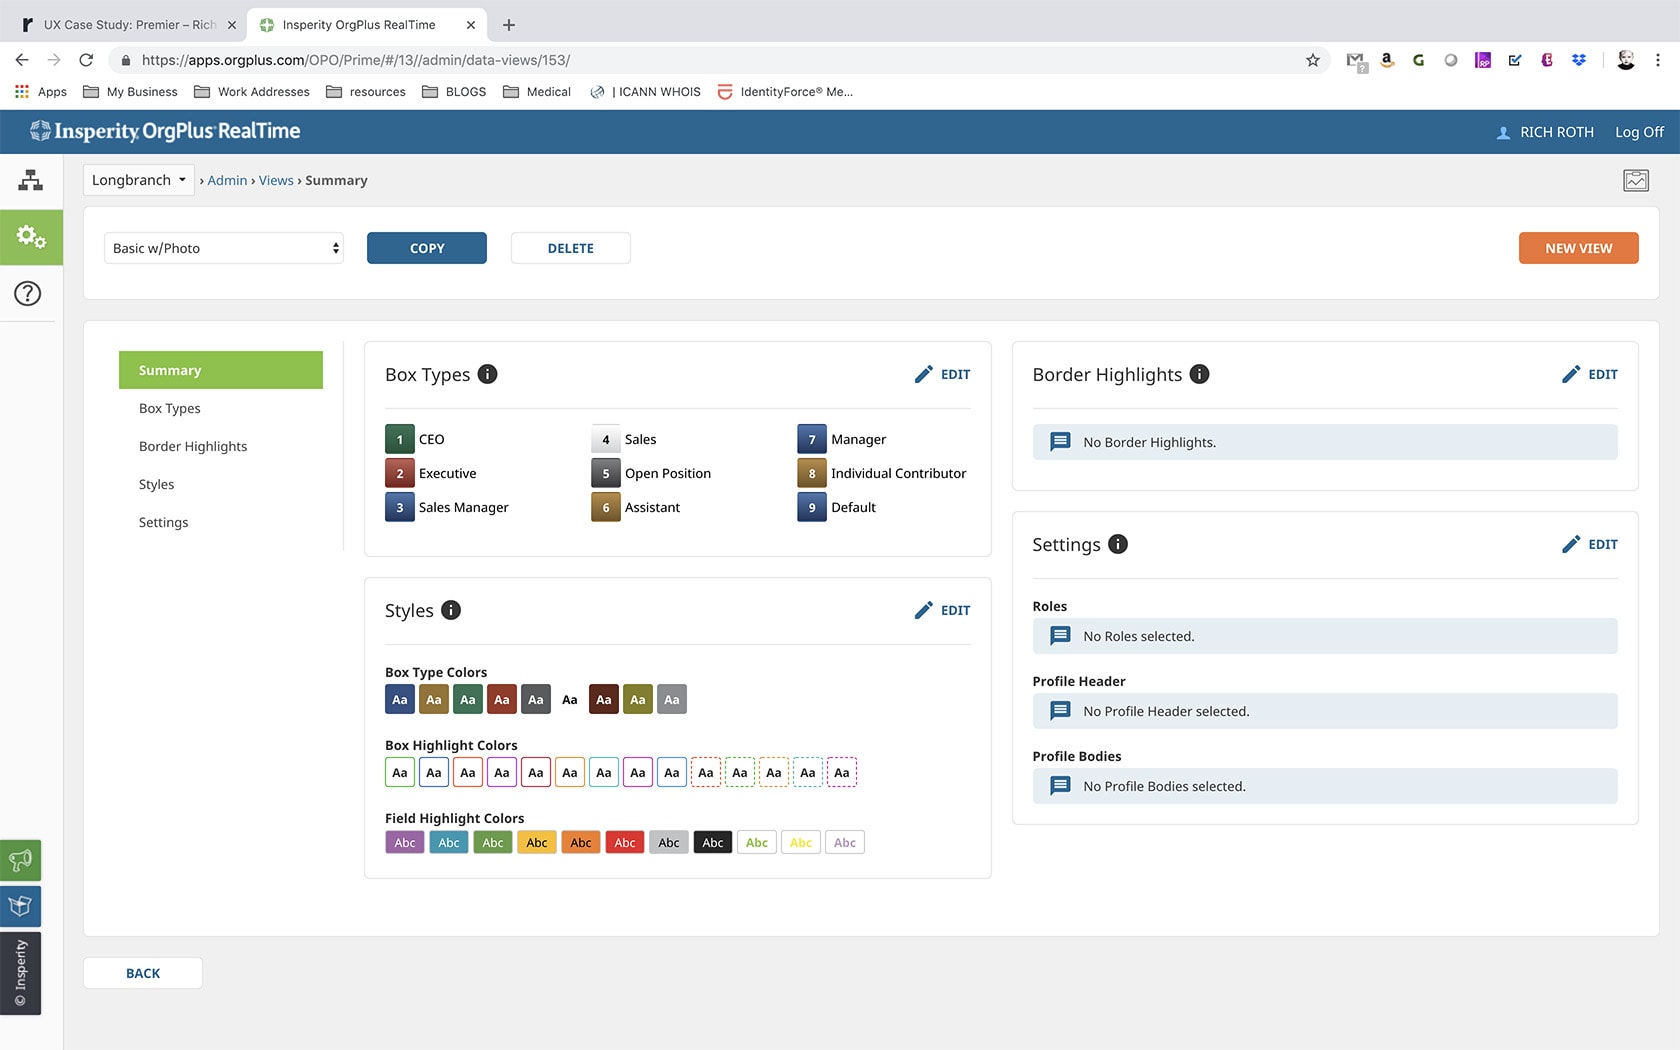
Summary
- Start with this section upon entry
- Add tool tip next to summary title
- Move description to summary (if created) and place at top
- Add ‘Styles’ widget to summary section
- Add ‘edit’ link in each widget
- Make each widget completely clickable to link to their respective sections
- Cards Widget
- Create ‘Inactive’ list
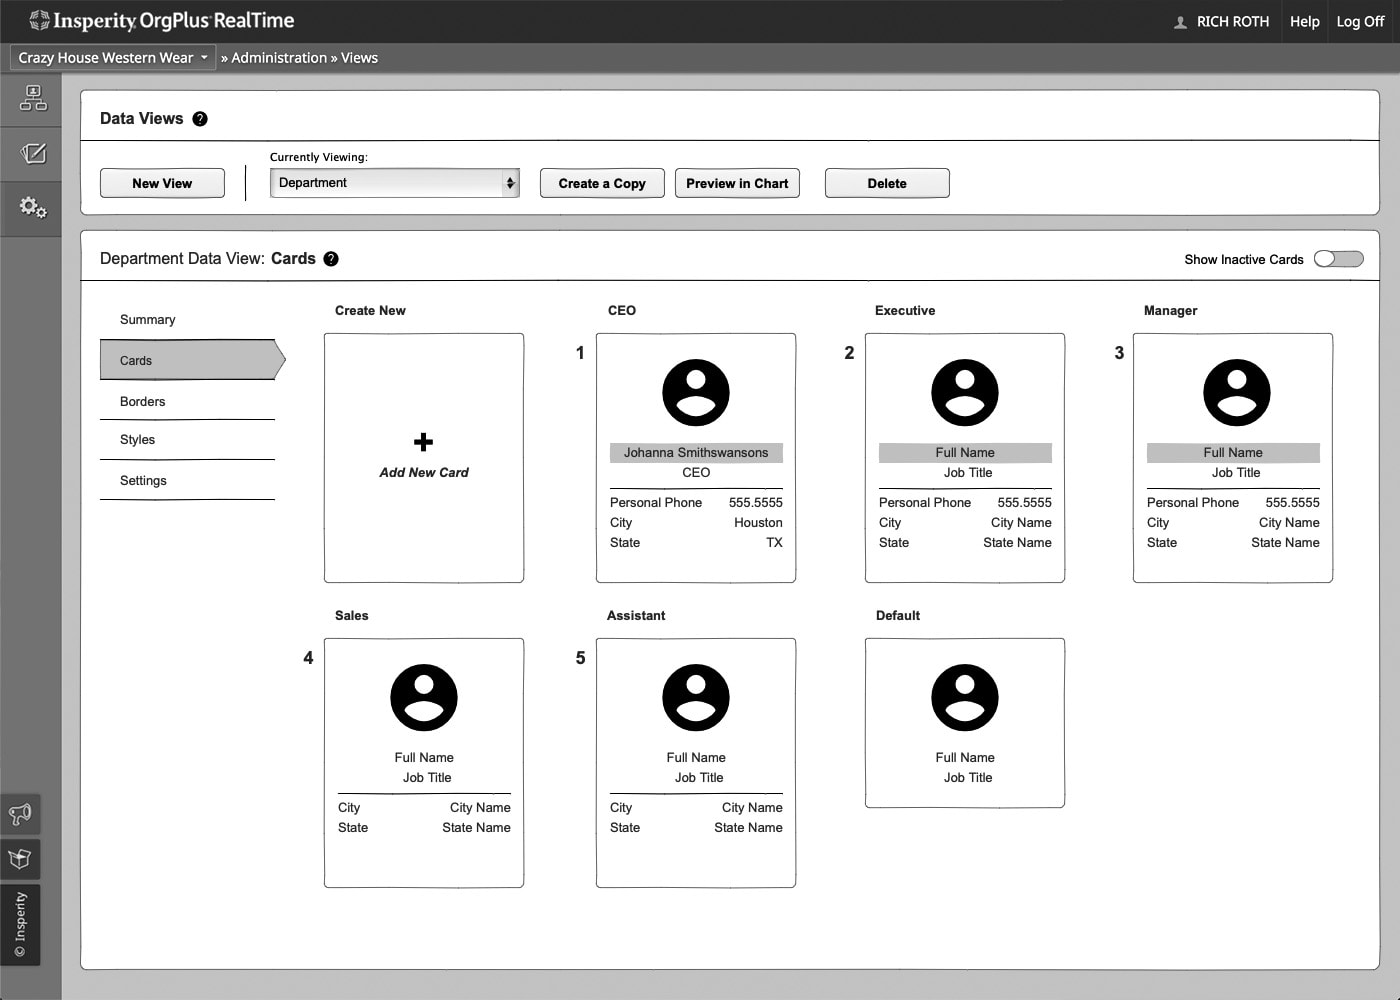
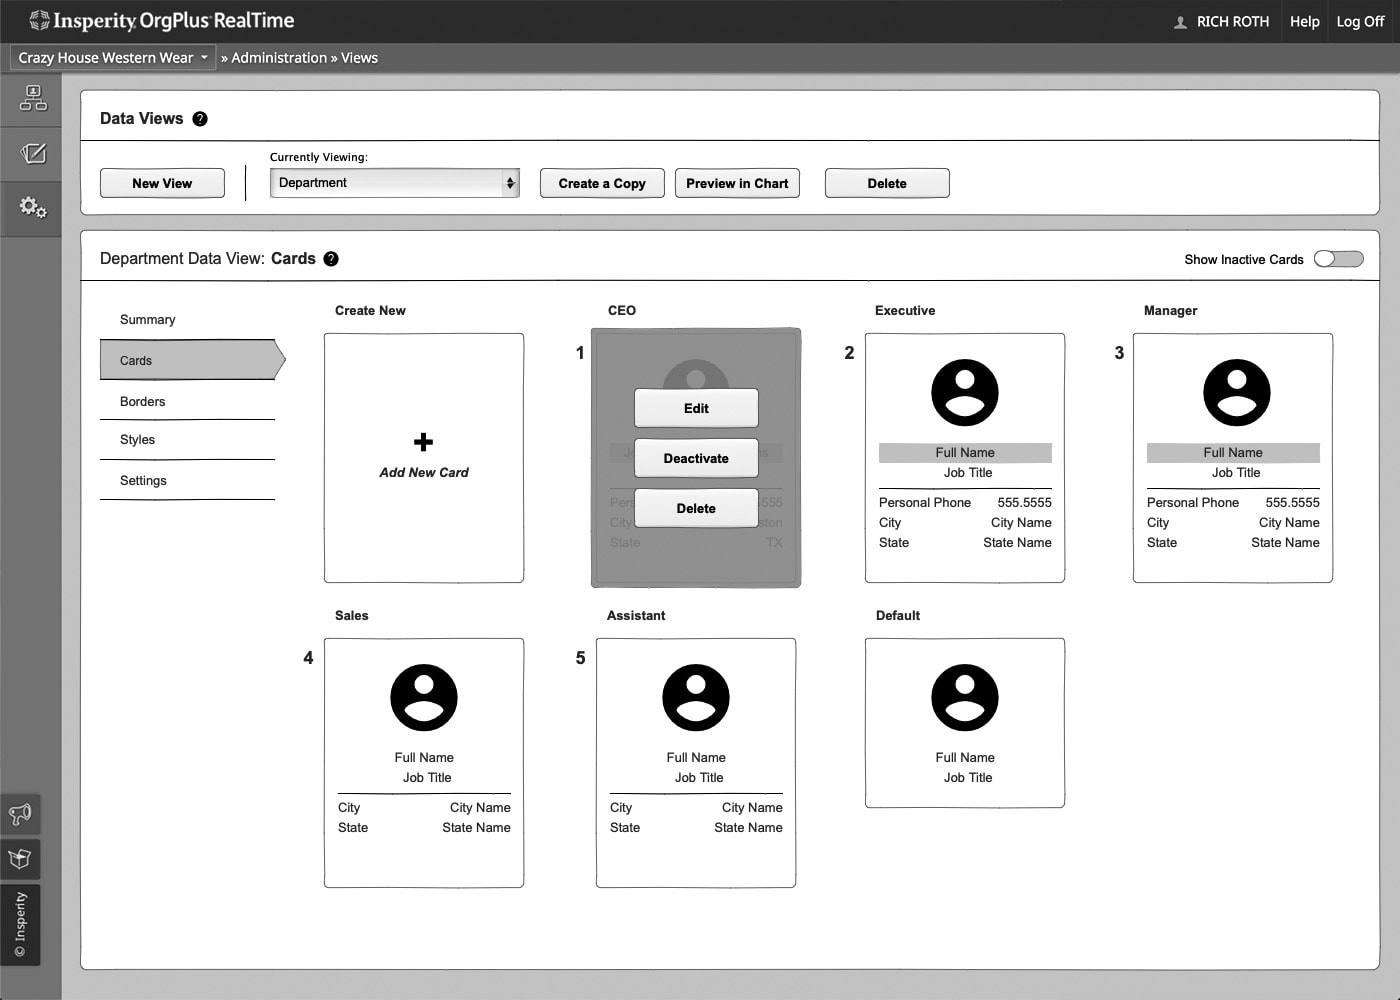
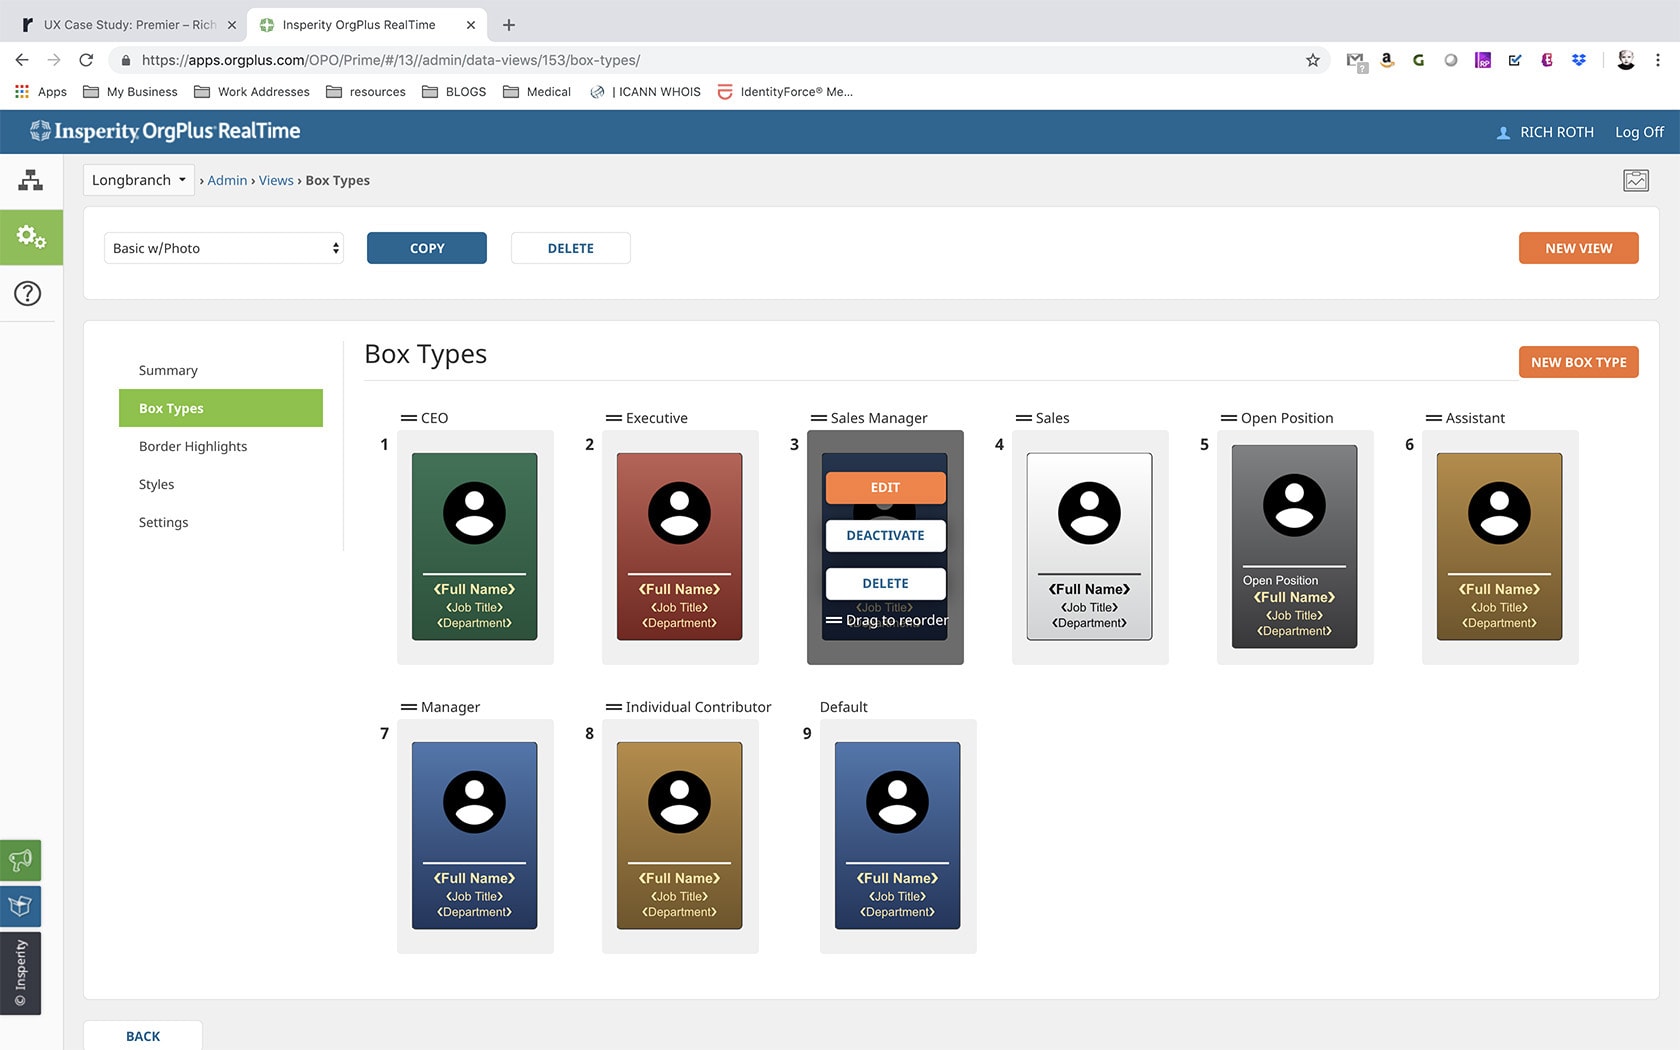
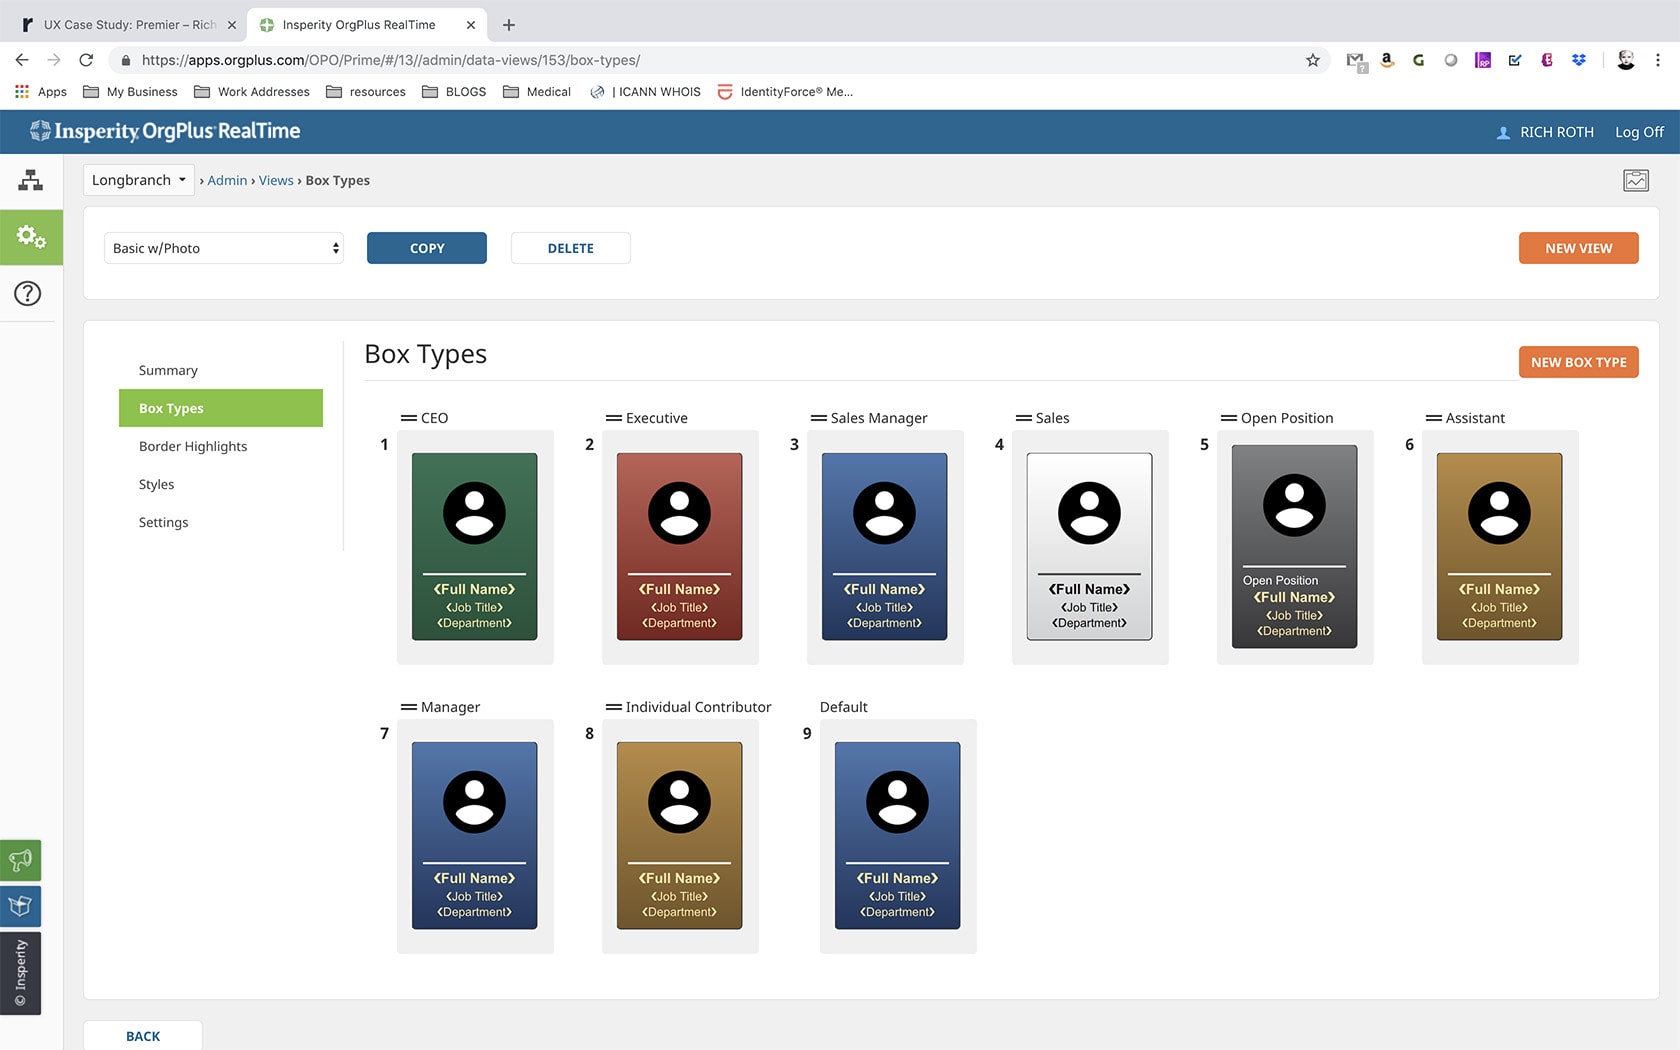
Cards Section
- Add tool tip next to Cards title
- Replace ‘New’ button with Manage
- Move ‘Add new card’ (create new box type) button in line with other cards
- Add a toggle for show/hide inactive cards
- Add numbering to cards to show Hierarchy
- Remove actions from top right of cards container and place in a hover state for cards which consist of
- Edit
- Deactivate/Activate
- Delete
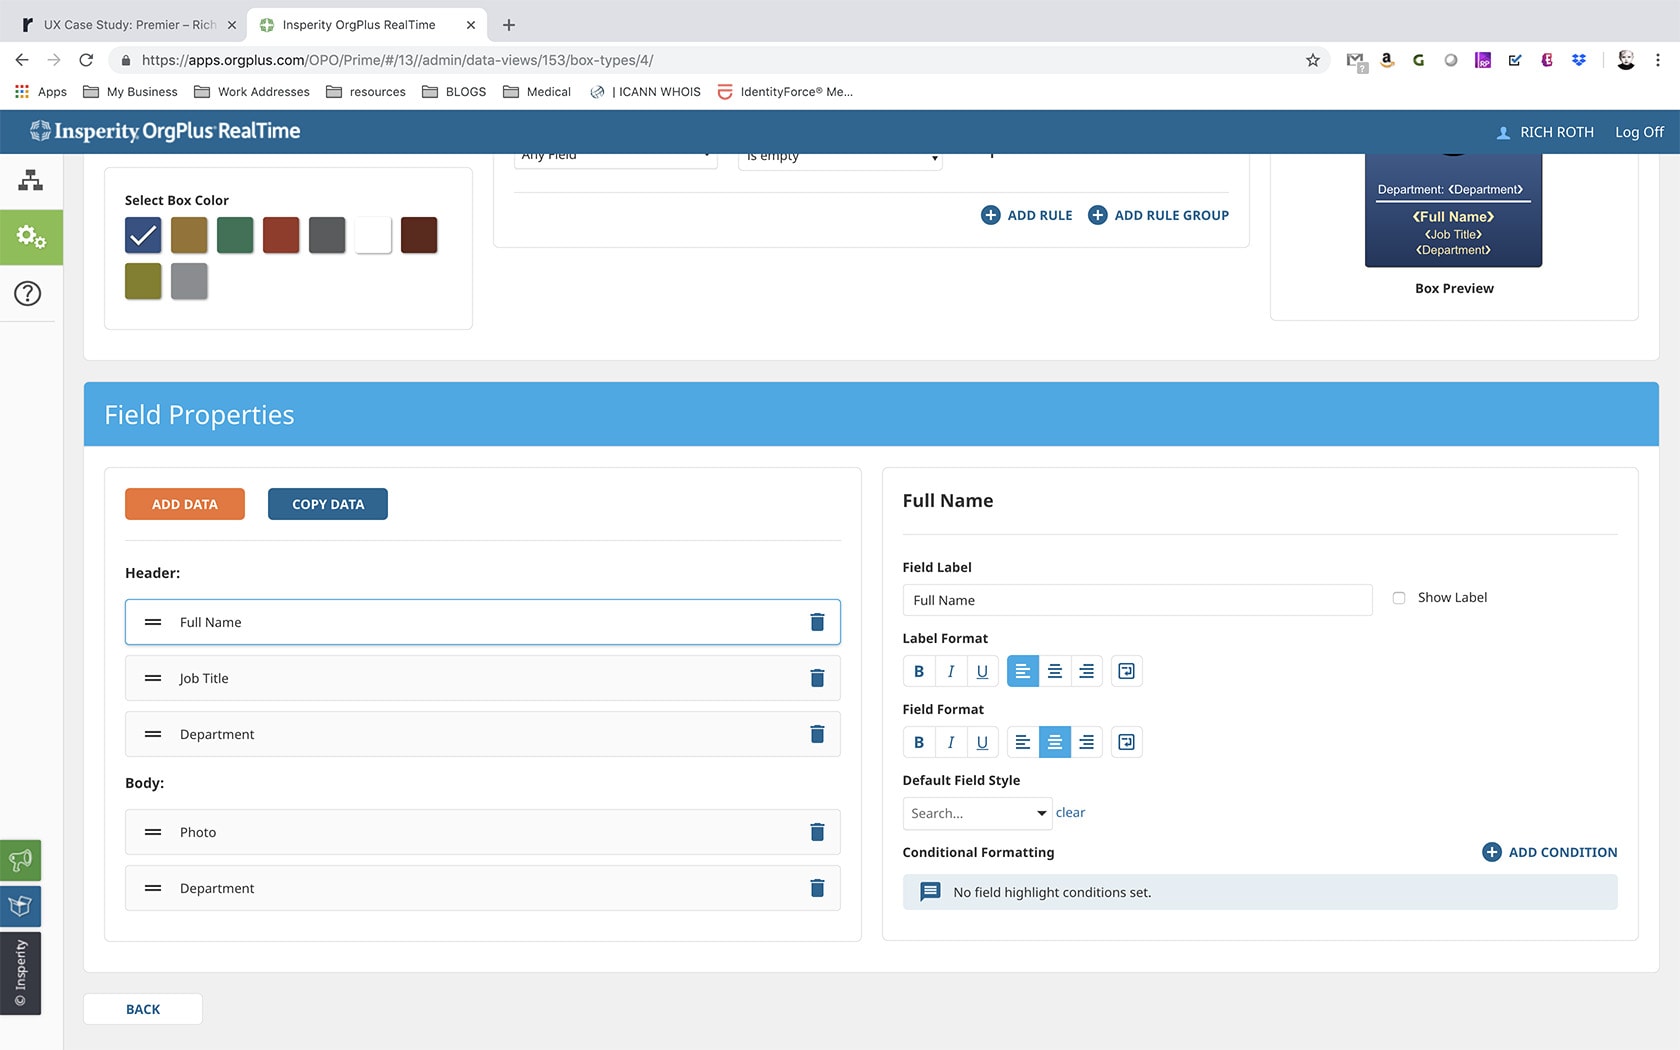
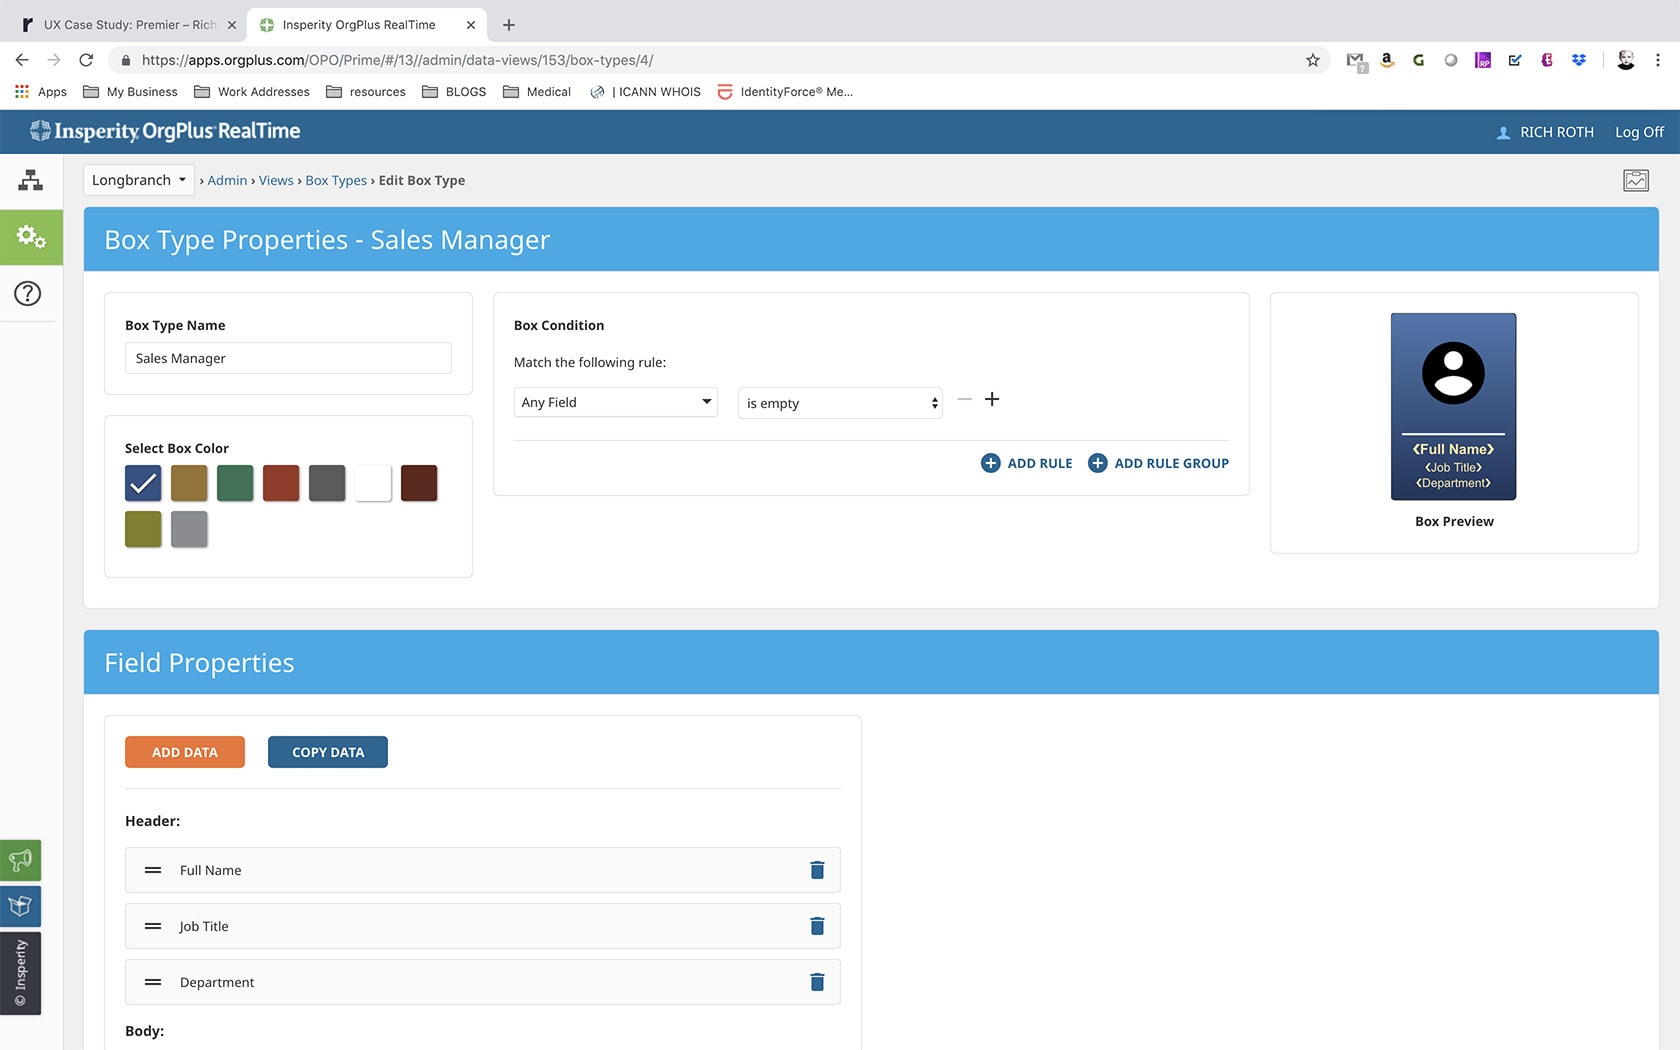
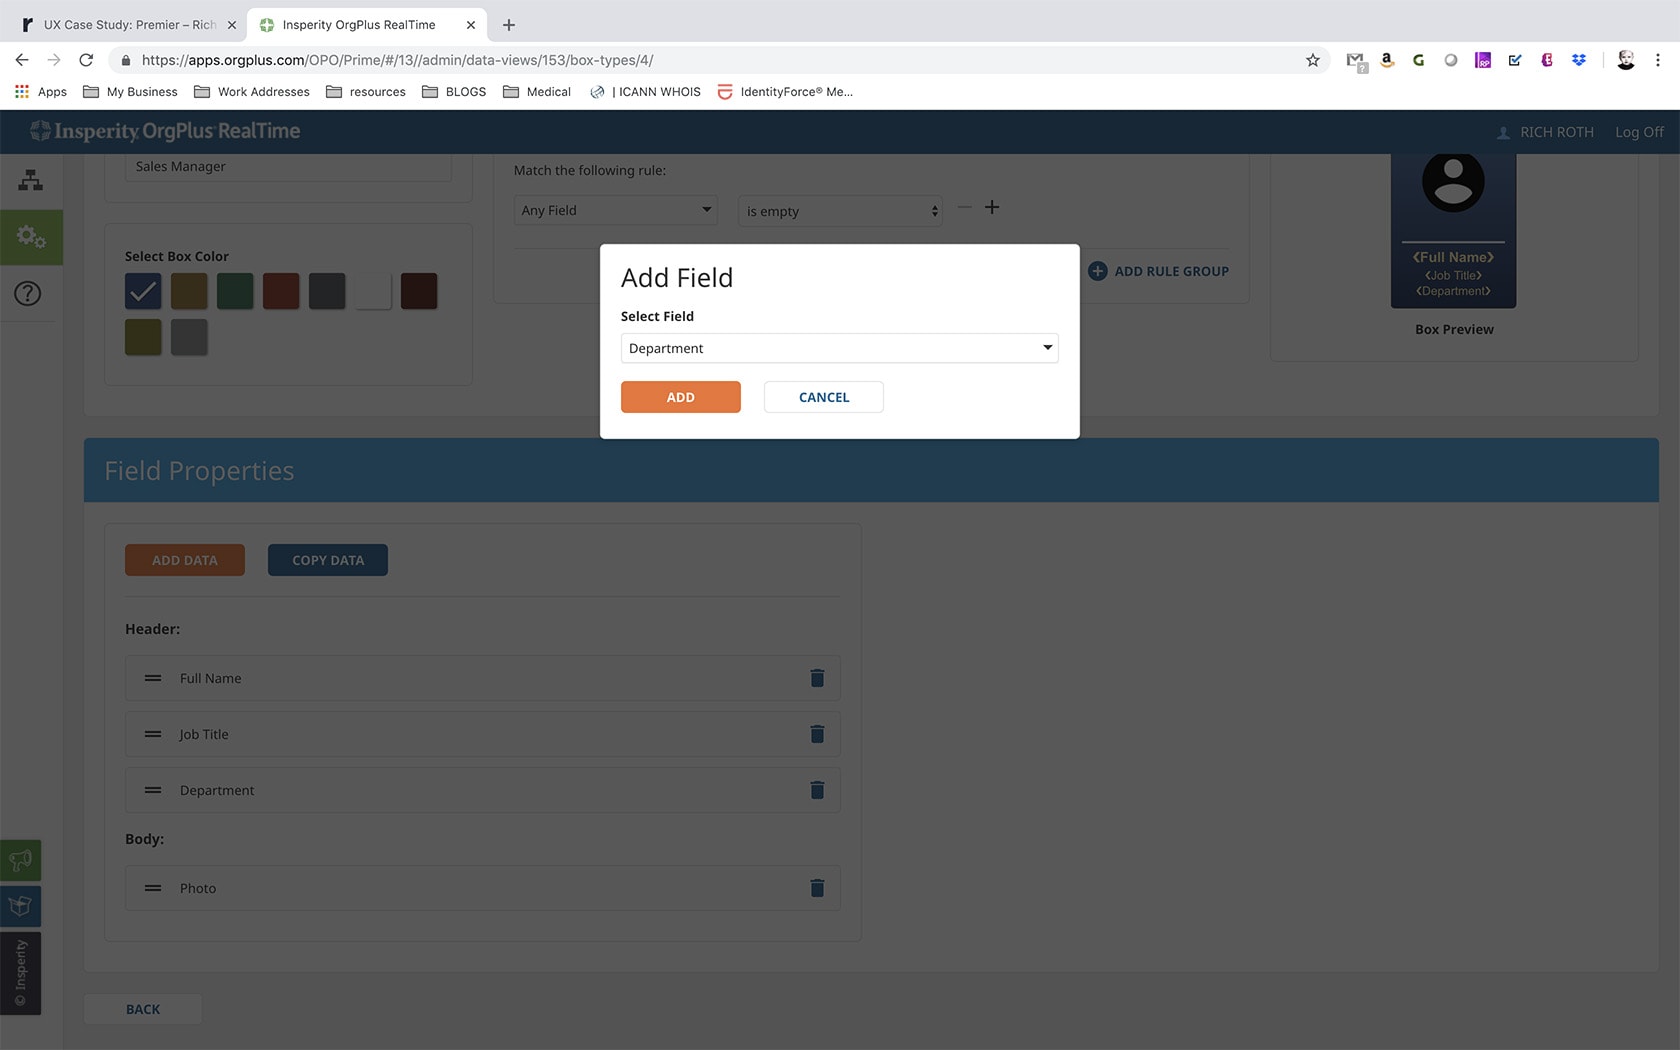
Add New Card
- Break into 3 section:
- A: Section title and card selection.
- B: Card Properties Section.
- C: Field Properties section
- BY DEFAULT: have Card Properties Section open when adding new card.
- Add a drop down to quickly cycle through all available cards to edit. By default shows “New Card” if add new card is clicked.
- Card Properties: section contains name, color and properties for card (now grouped in one area)
- Field Properties Section: section contains all other editing capability of card from a field standpoint.
- Lay page out in 3 column grid
- Col 1: add new card button, followed by list of cards in view
- Col 2: Card properties
- Col 3: Hot link to customize card (edit) and preview (color/text color preview)
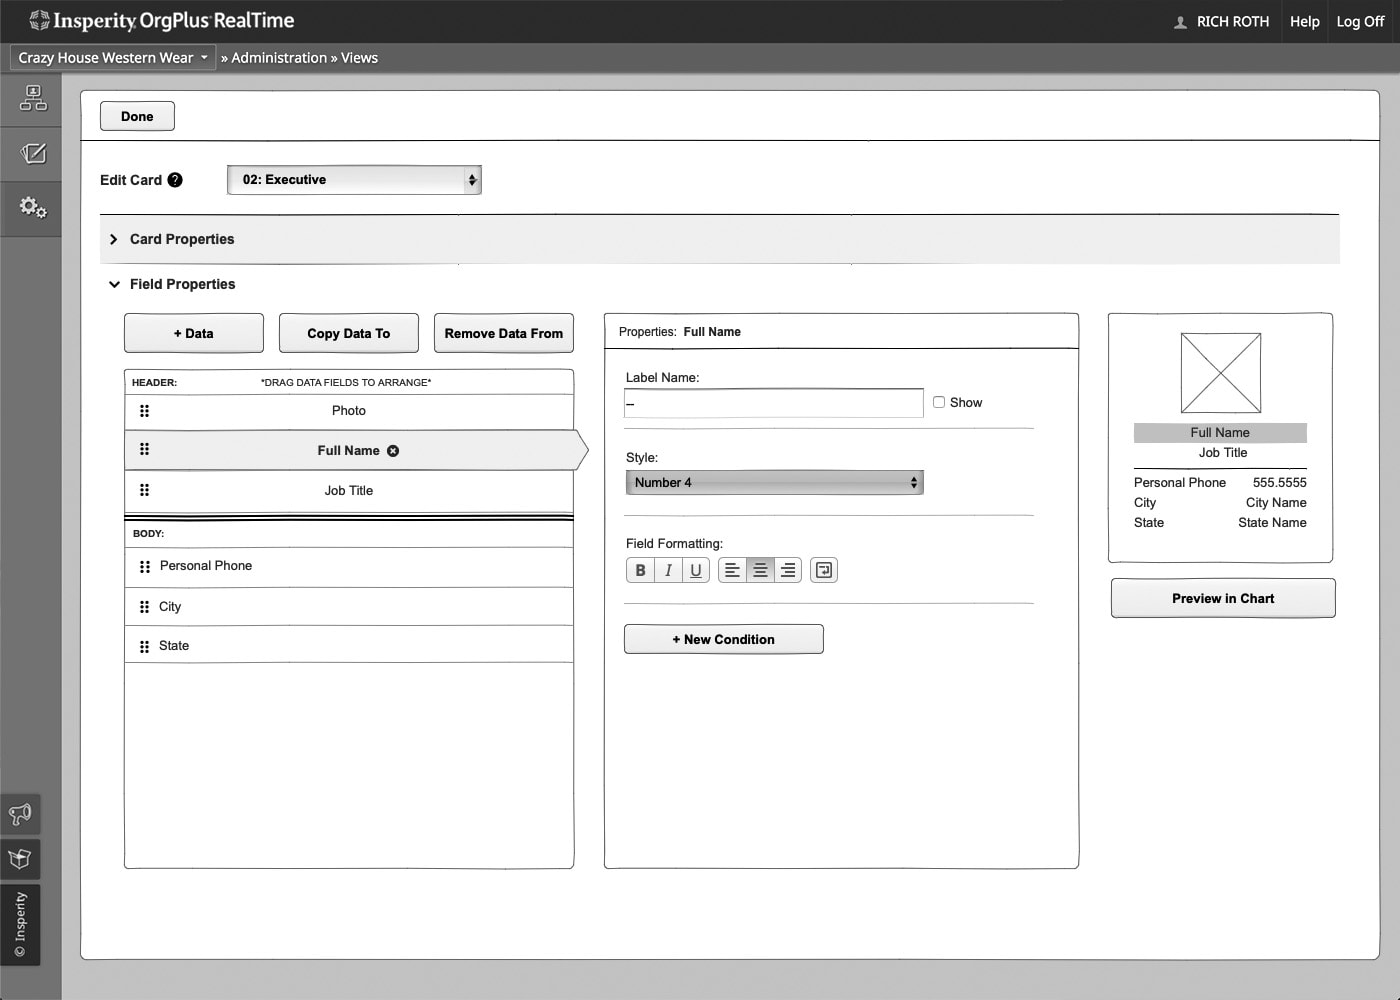
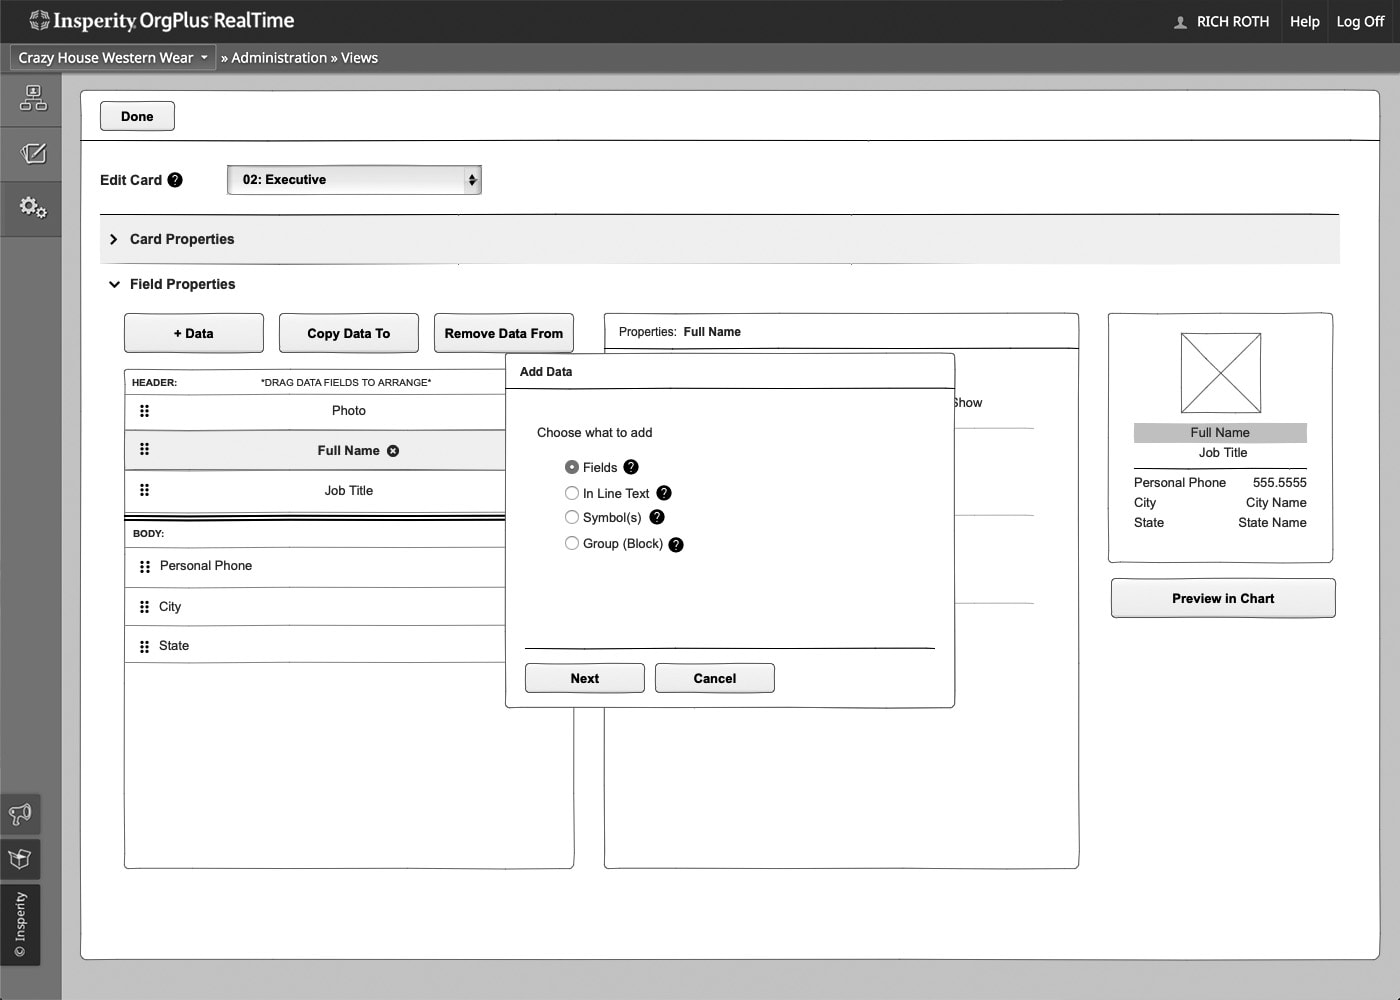
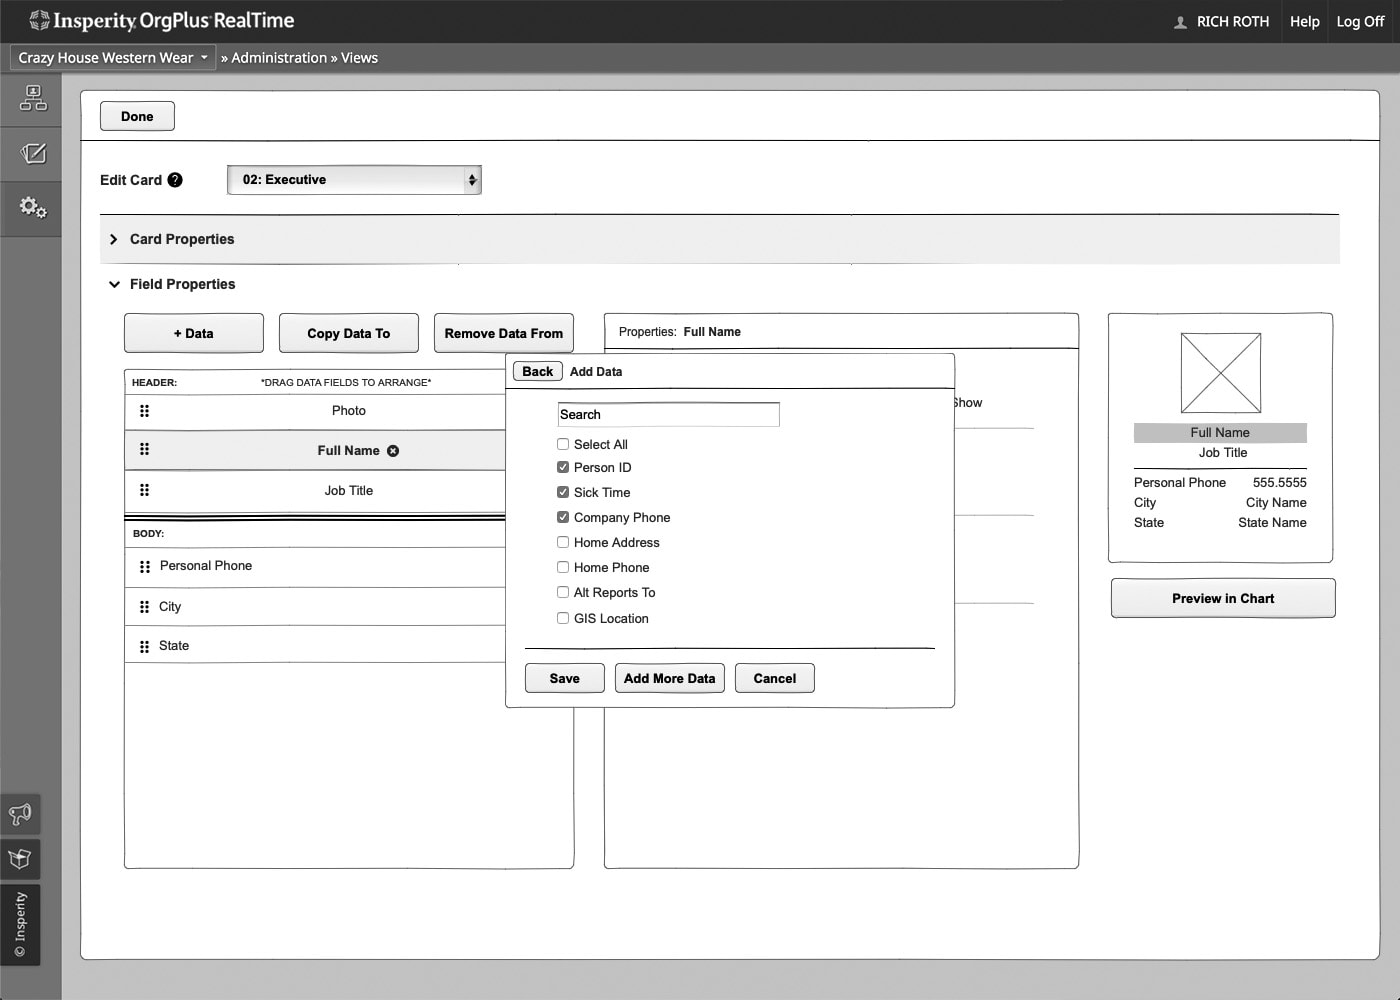
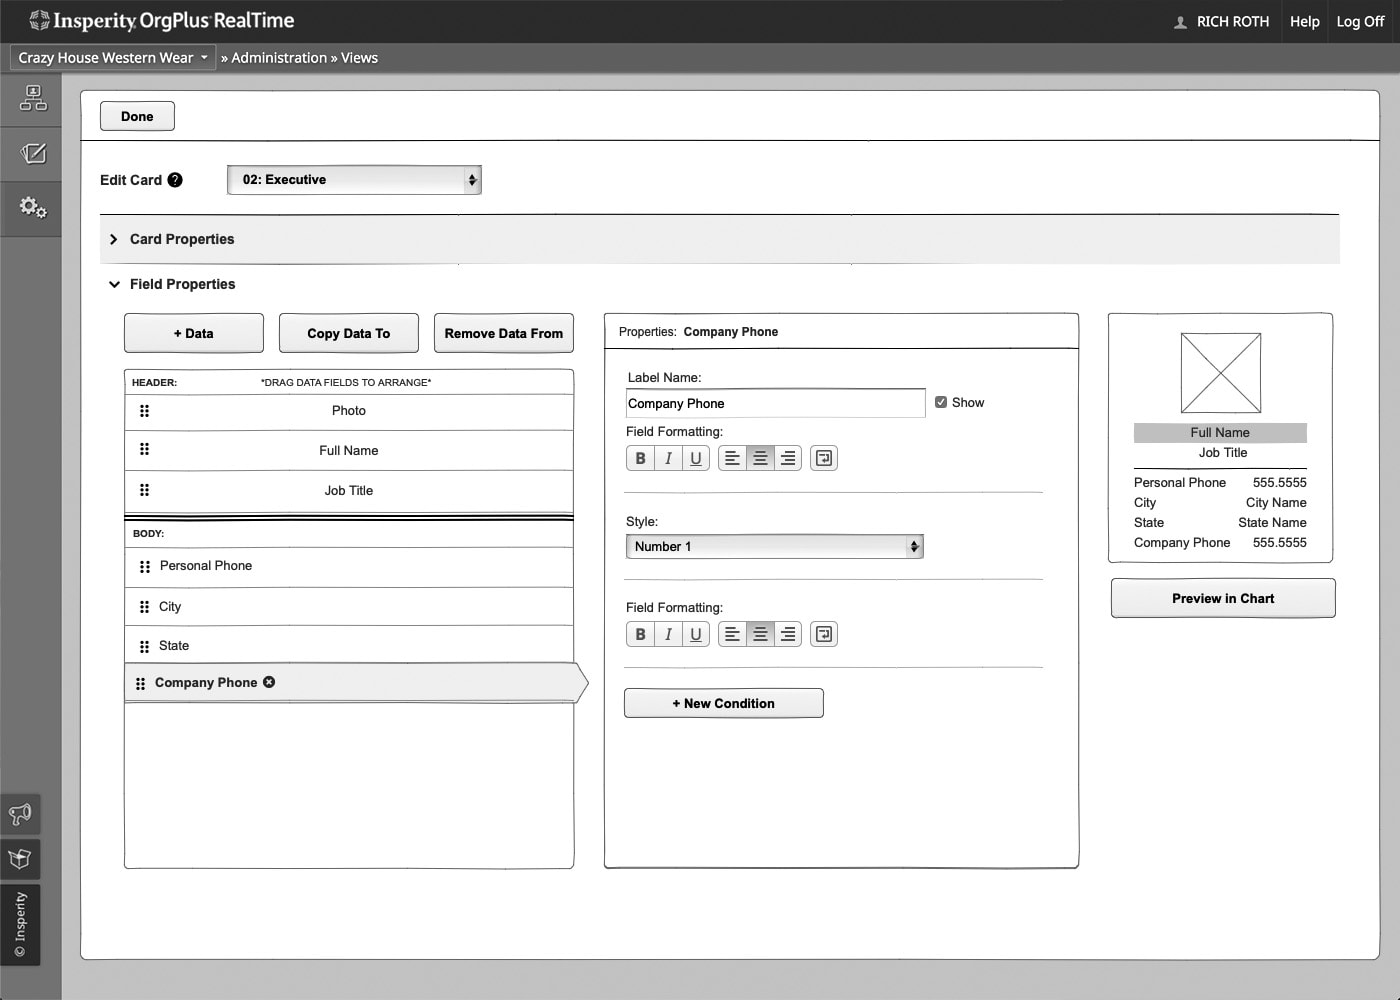
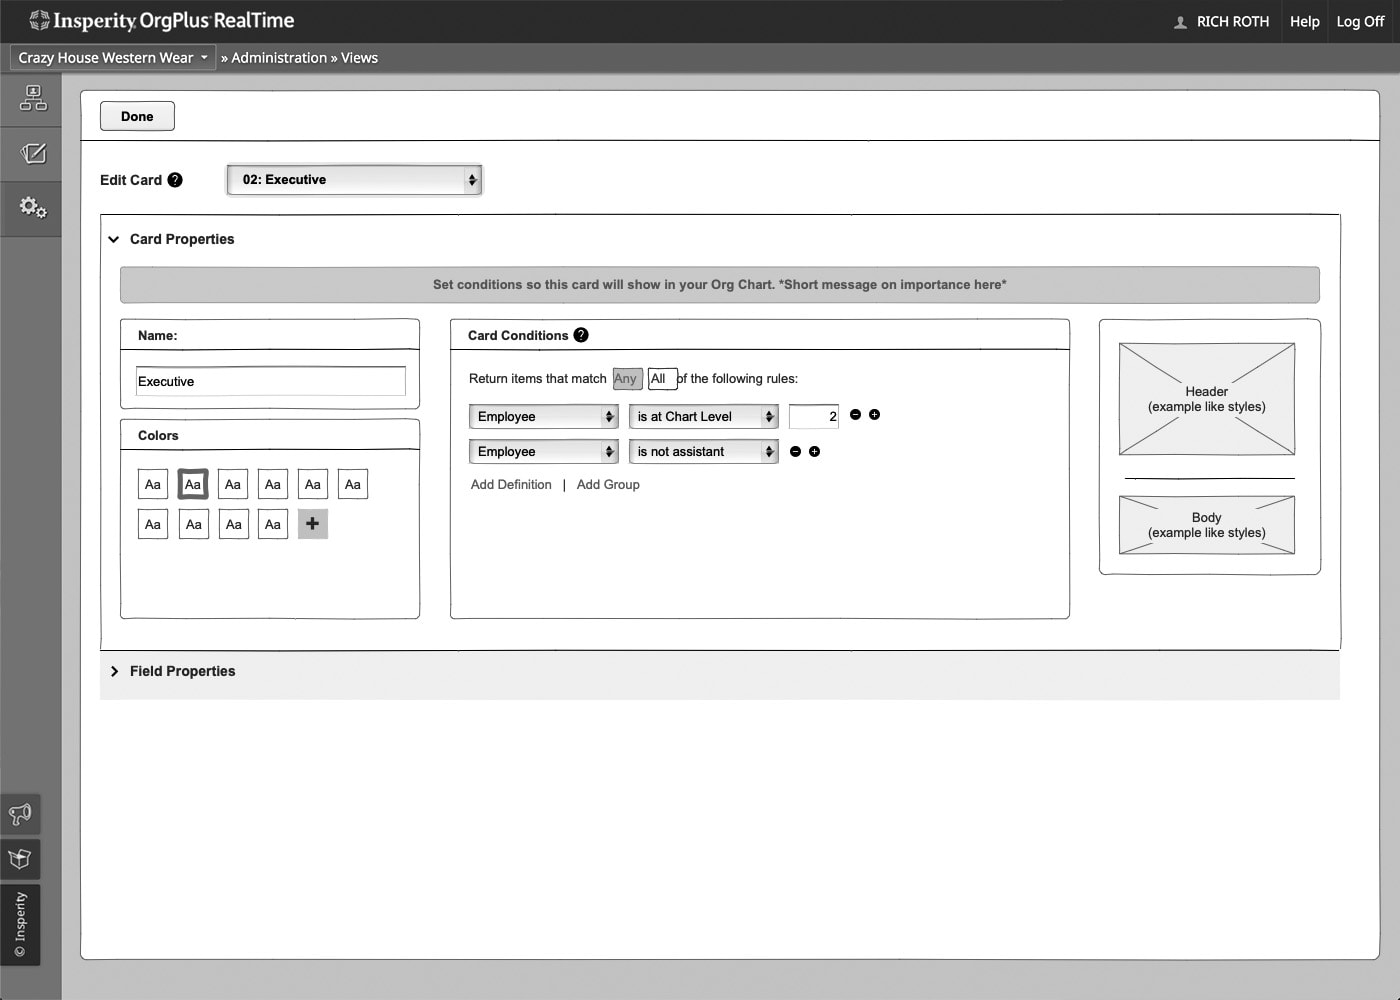
Edit Card
- Add Tool tip to explain edit card
- Break into 3 sections:
- A: section title and card selection drop down.
- B: Card Properties Section.
- C: Field Properties Section.
- BY DEFAULT: have Field Properties section open when editing.
- Add a drop down to quickly cycle through all available cards to edit
- Add a ‘Currently Viewing’ drop down to quickly cycle through all available cards to edit
- Move action buttons to the top to provide visual clarity
- Add Data (Step through modal)
- Copy Data To (Step through modal)
- Remove Data From (New functionality) (Step through modal)
- Use 3 Column layout
- See example
- Add Button called ‘Manage Card Properties’ that takes you to manage cards location
- See manage cards section
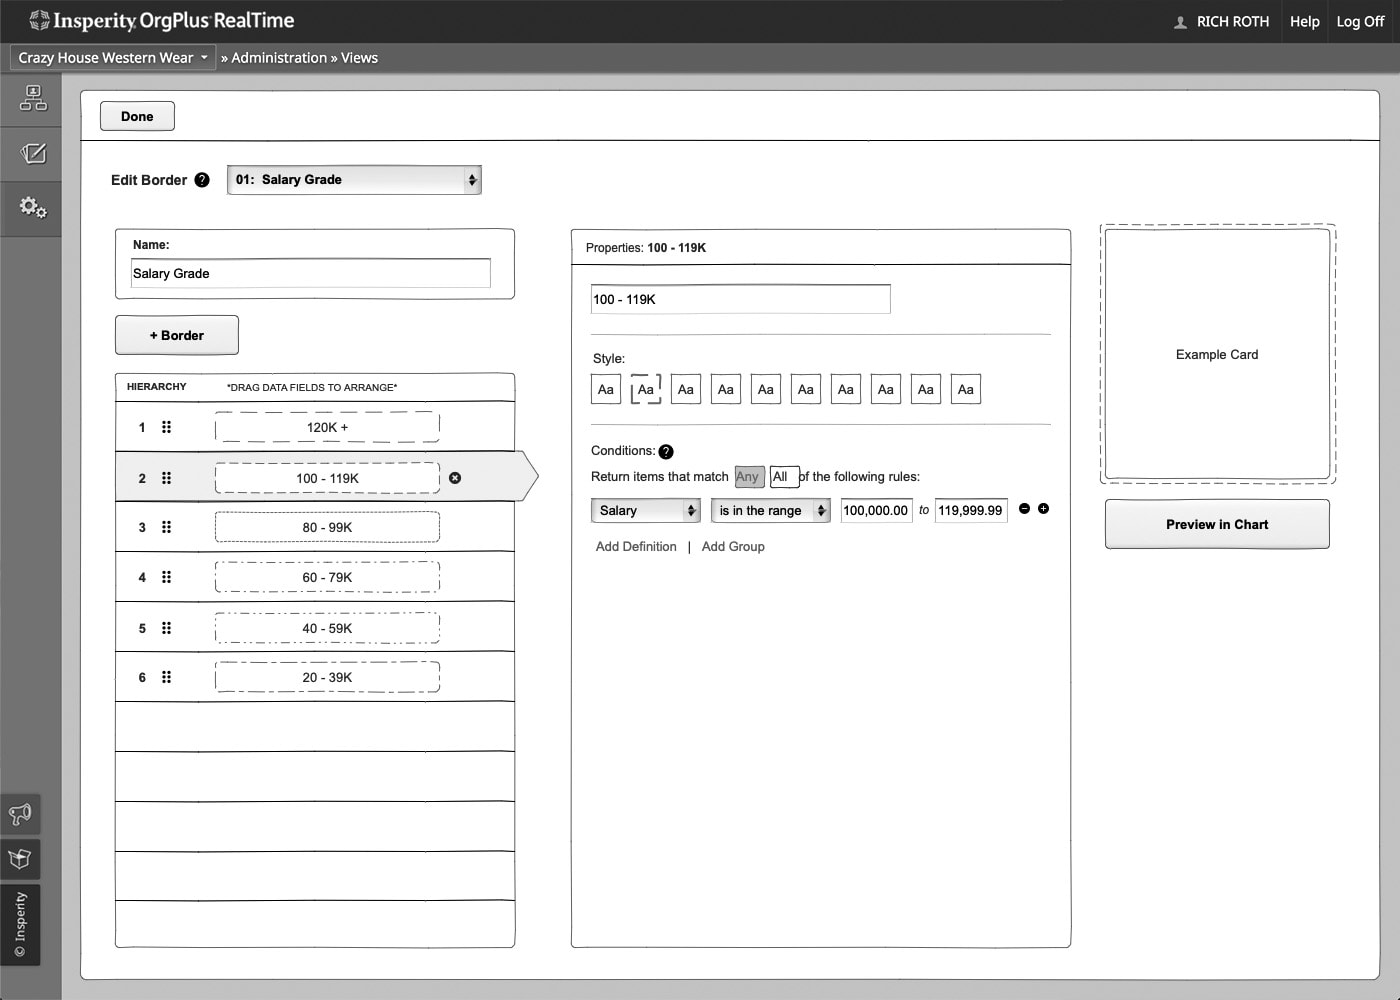
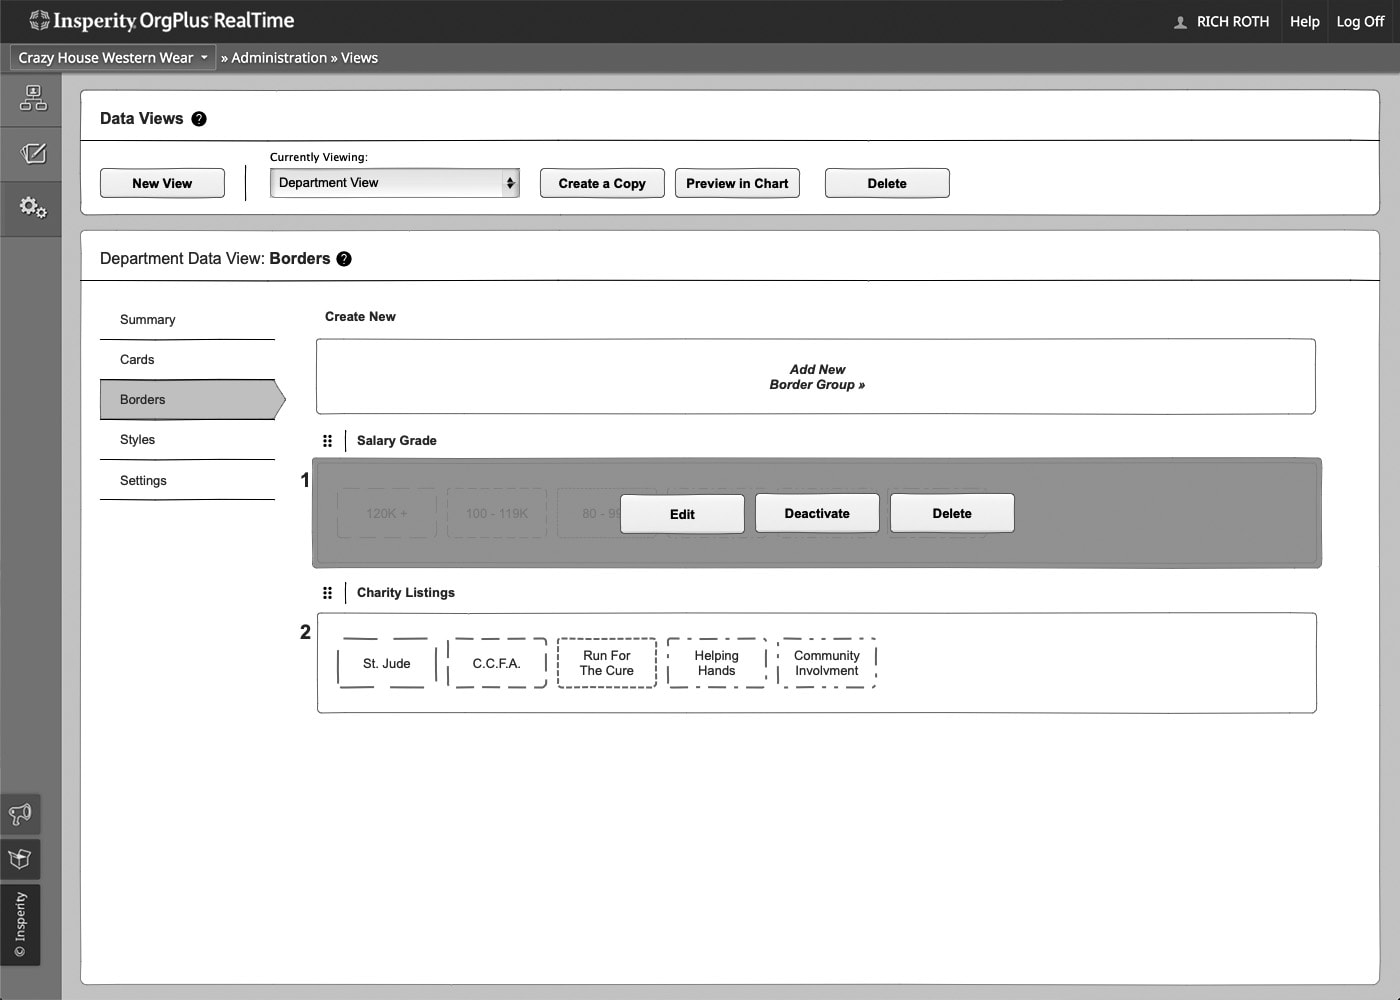
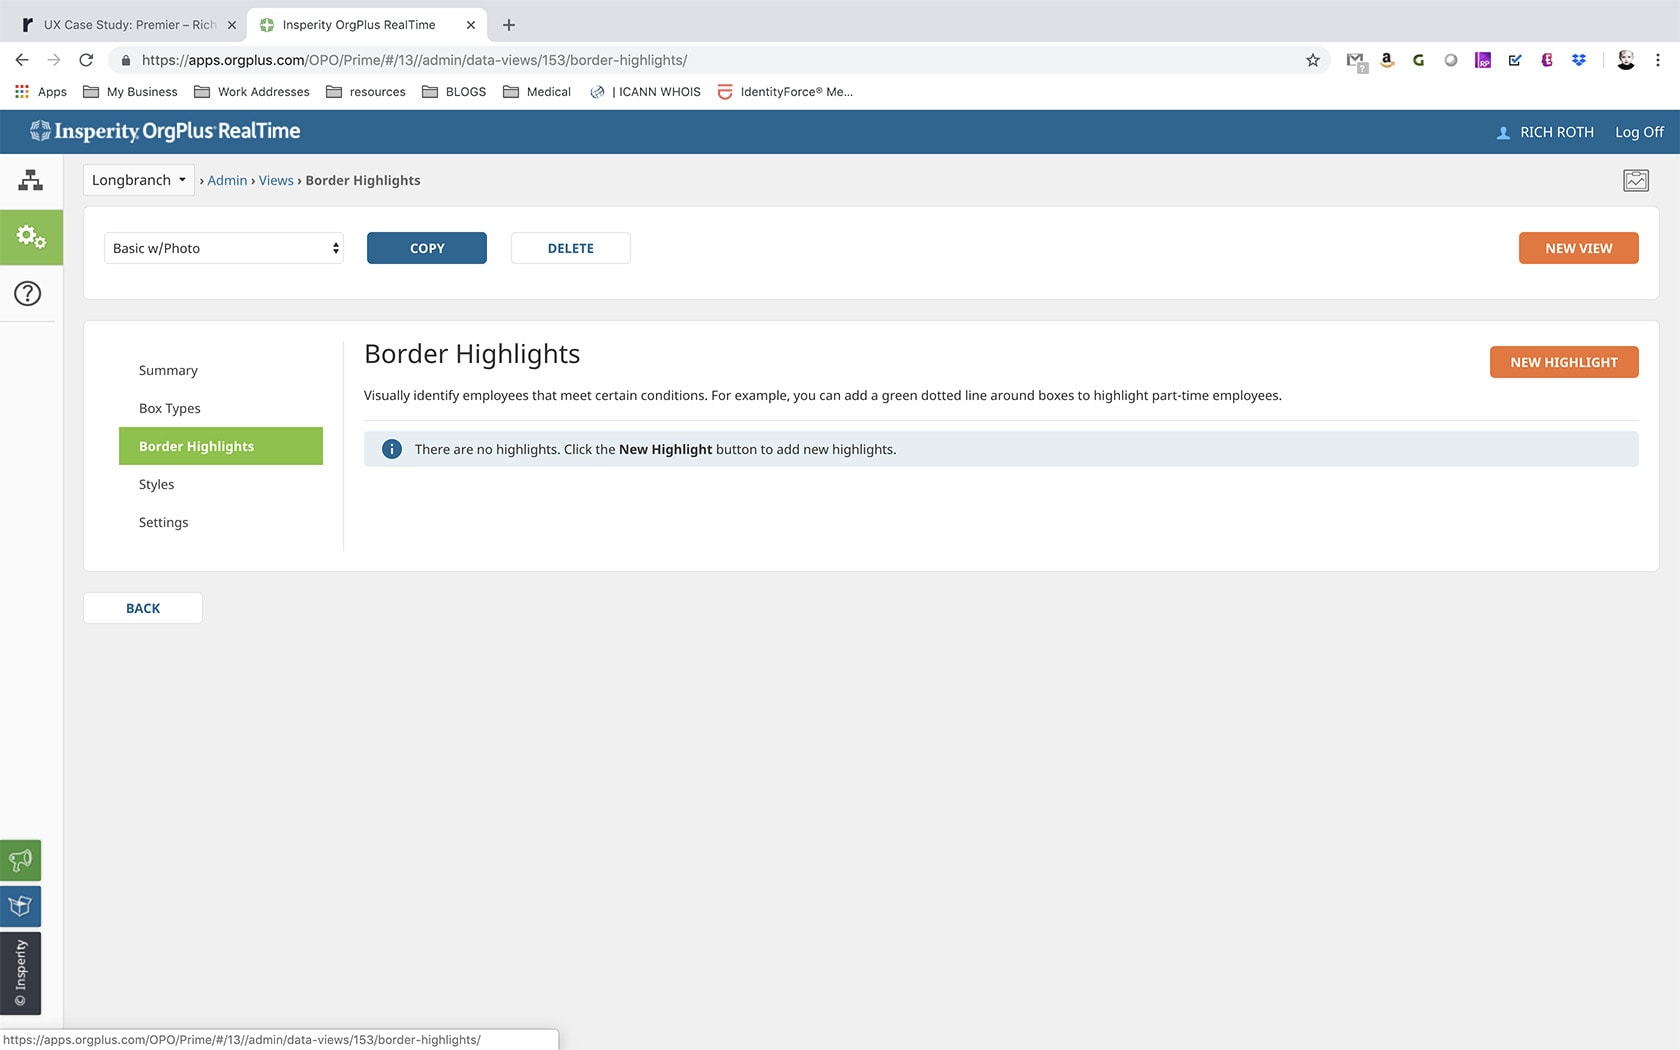
Borders
- Rename ‘Highlight Groups’ to ‘Borders’
- Add tool tip next to Borders title
- Creating New/Editing
- Opens a page vs a modal
- Page uses 3 column layout
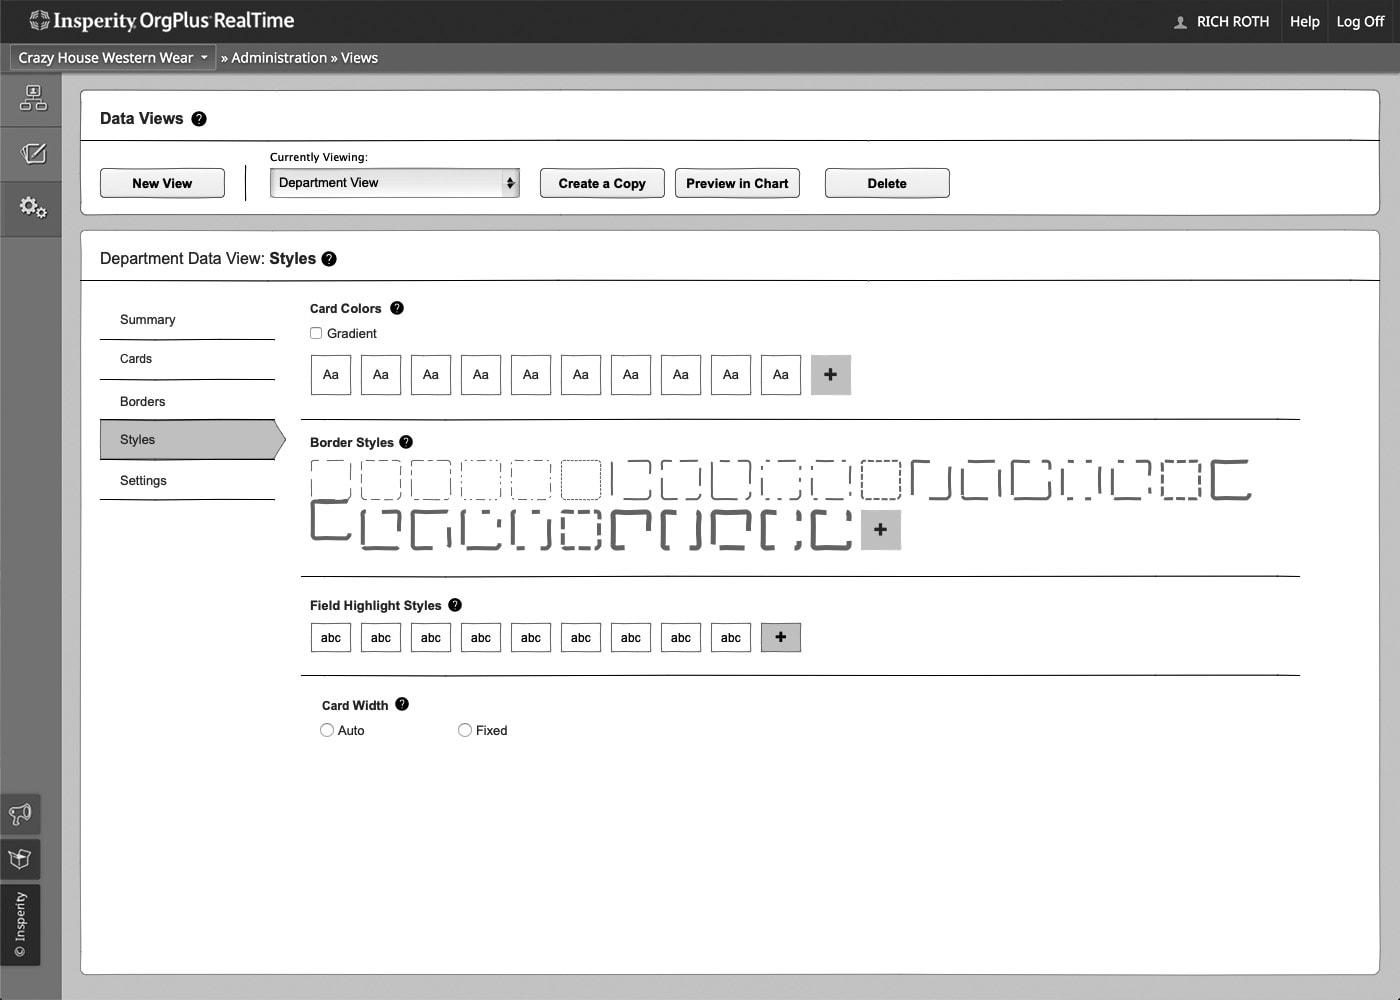
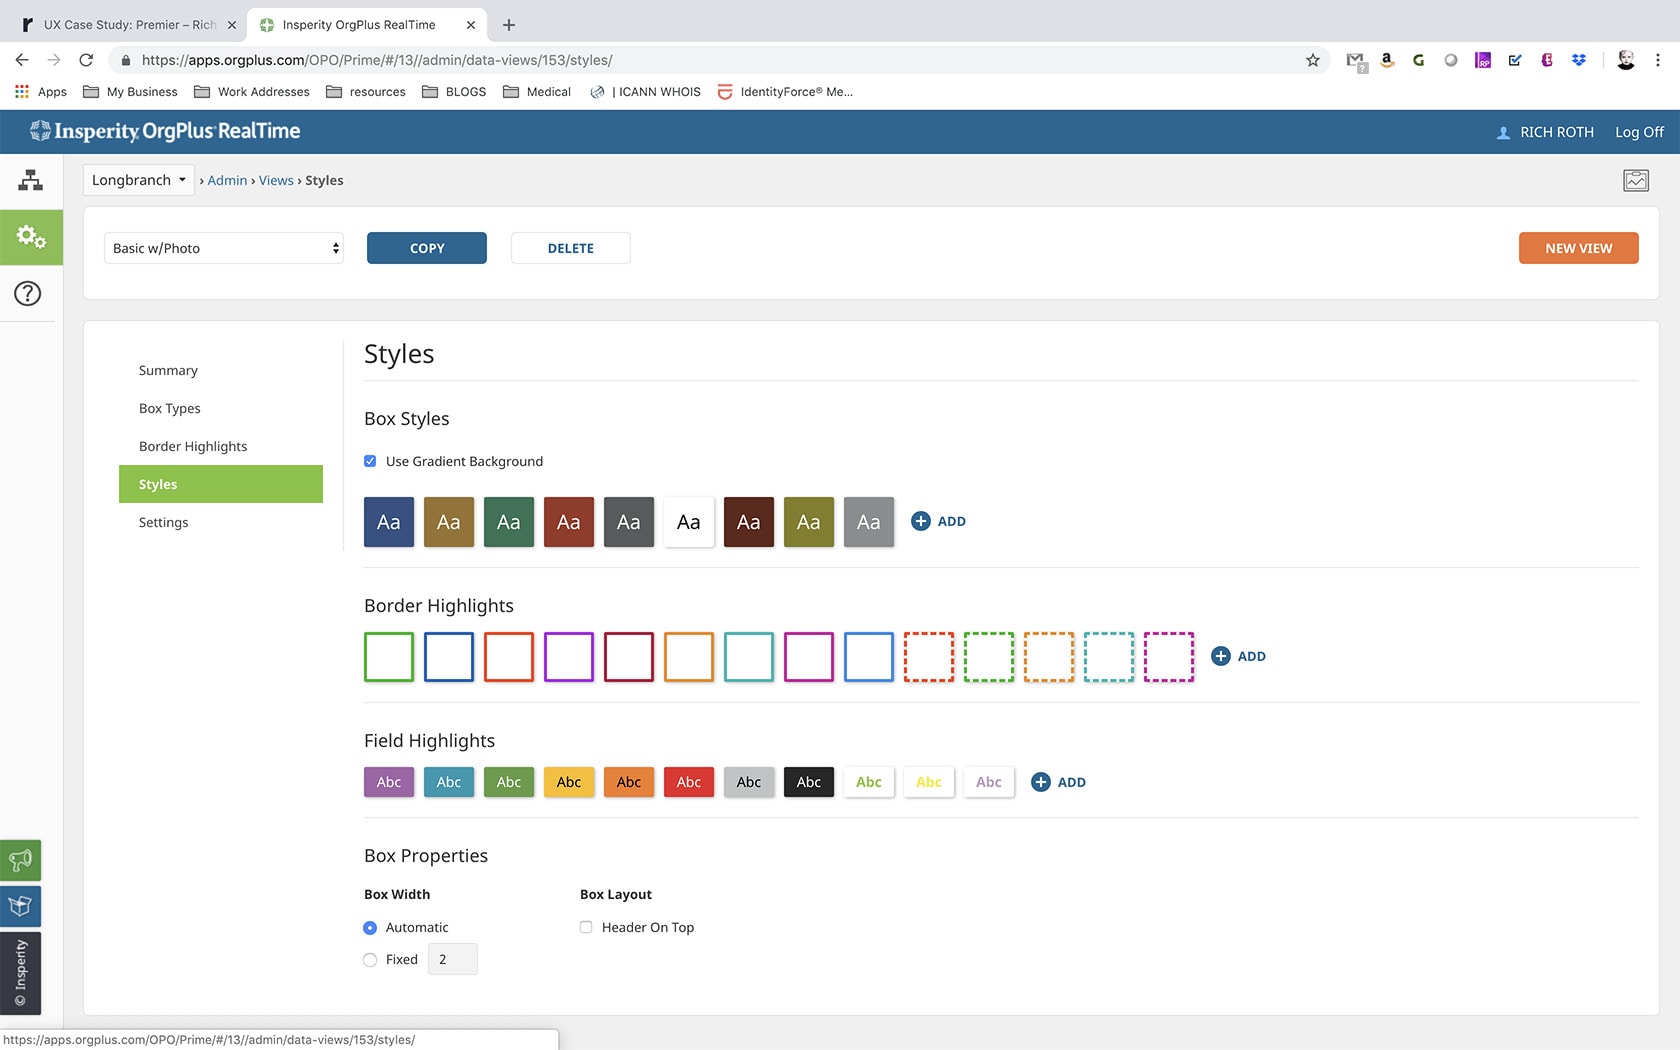
Styles
- Make styles the 4th option in the left nav list
- Add Tool tip next to styles title and each section in styles
- Add ‘Gradient’ check box in ‘Card Colors’ options area
- Rename Box Highlight Styles to ‘Border Styles’
- Remove ‘Box/Card properties section
- Add ‘Gradient check box’ to Card Styles
- Remove option ‘Header on bottom’
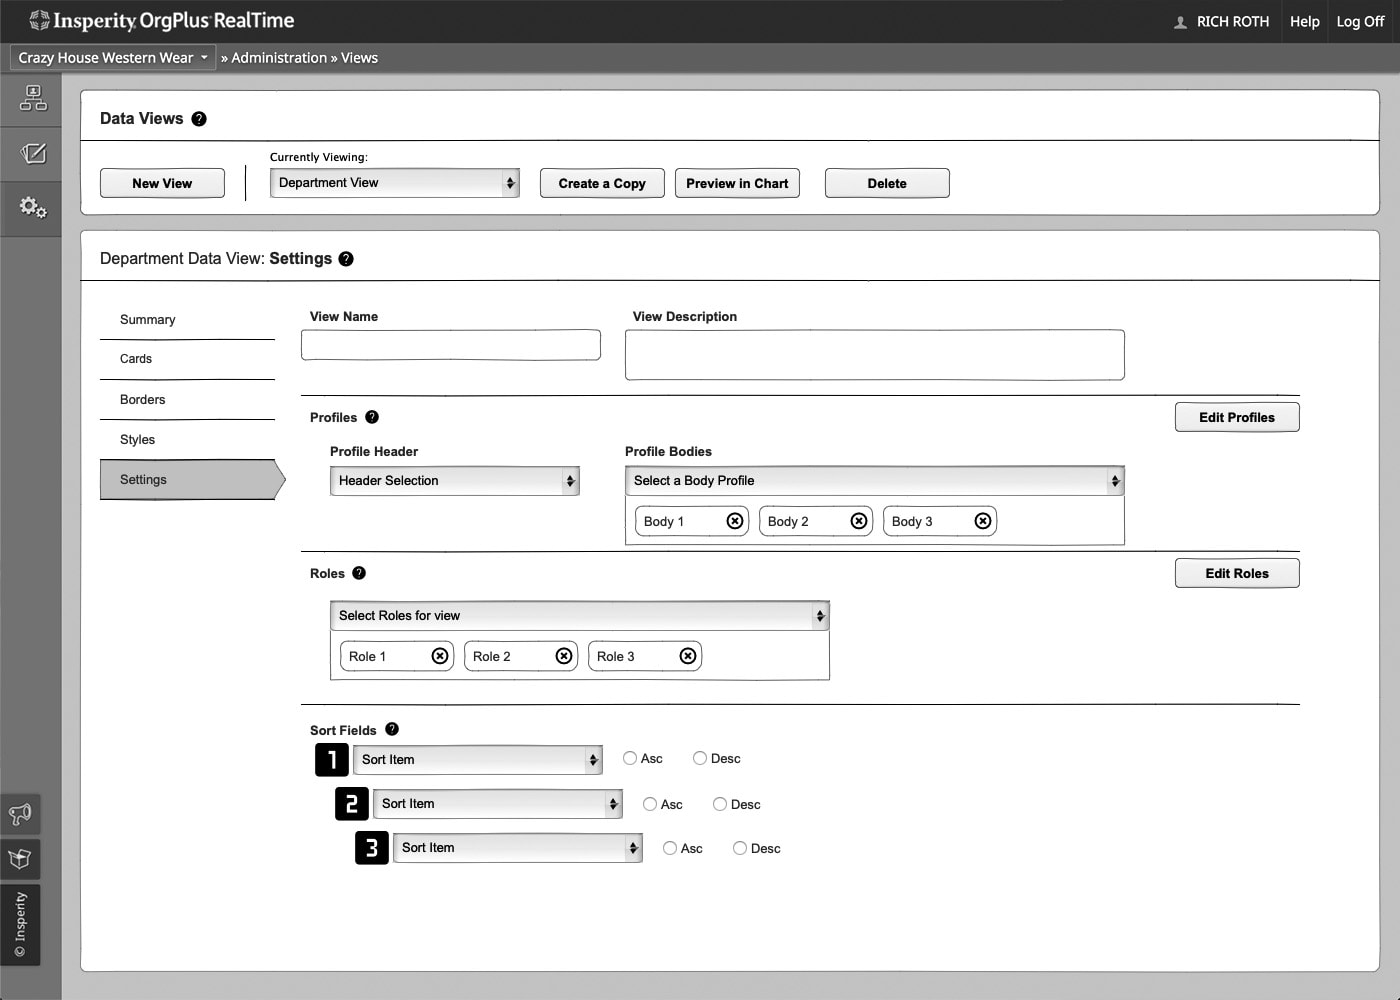
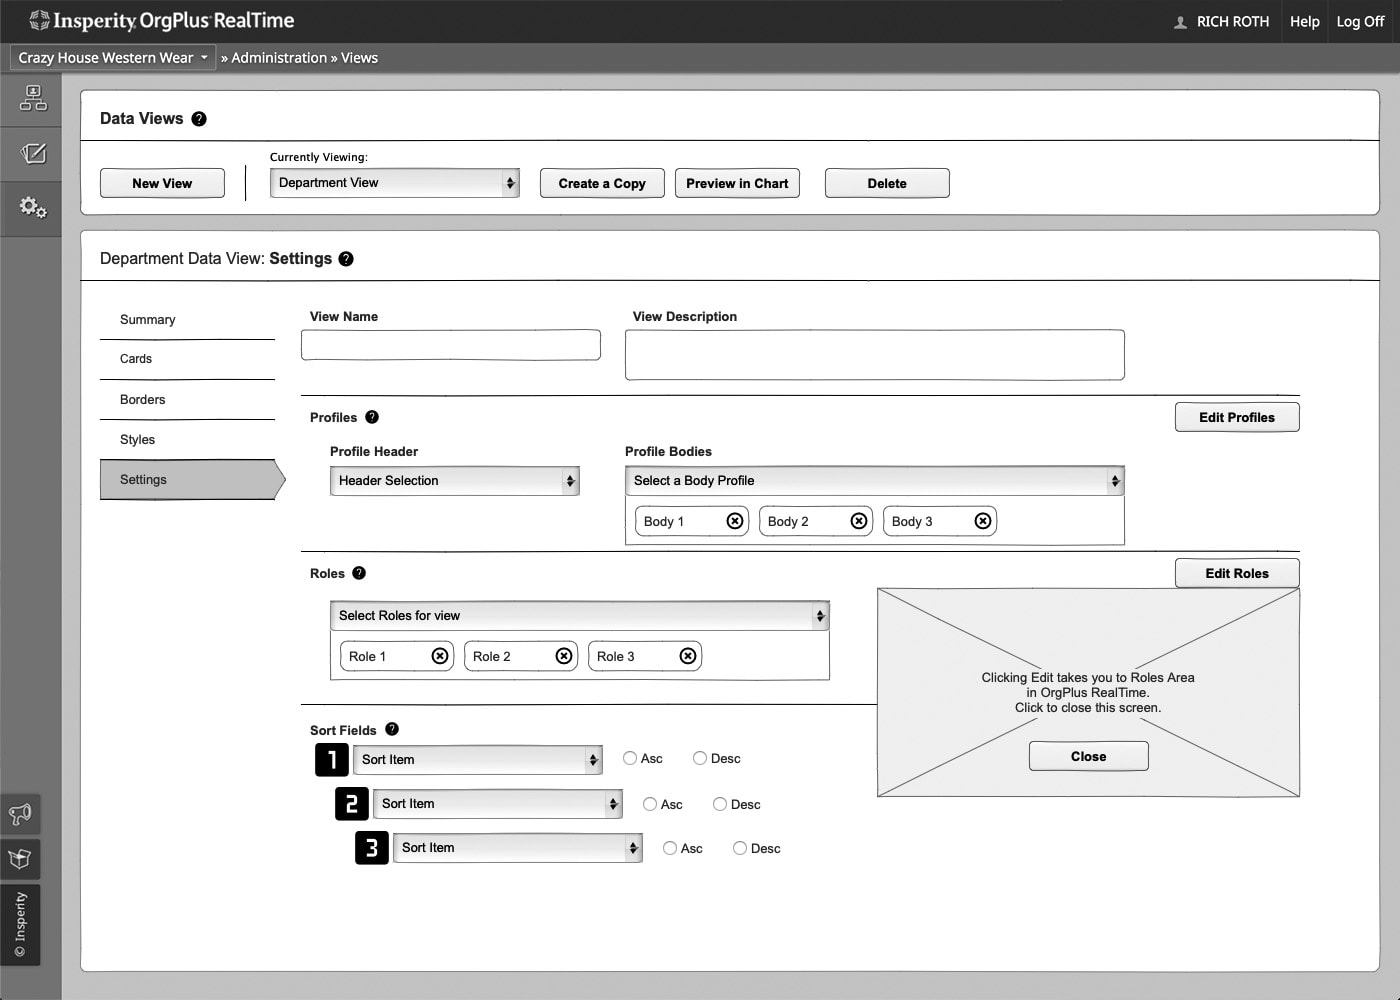
Settings
- Rename ‘properties’ to ‘Settings’
- Rearrange order of settings options
- Name, Description
- Profiles
- Roles
- Sort Fields
- Grant ability to link to profiles section from here
- Once in profiles from starting at views, clicking ‘Done’ Returns to ‘Data Views/Settings’
- Grant ability to link to roles section from here
- Once in roles from starting at views, clicking ‘Done’ returns to ‘Data Views/Settings’
Deliverables:
Tools Used:
MS Excel
Basecamp
06: On-Going Evaluation: Continue to evaluate product after release to validate impact with project goals.
- Monitored feature release and checked in with end users to see how the feature update was meeting their needs and expectations.
- Review analytics
Actual Application:

Get in touch and let's get a conversation going!
I would love to create with you. For any questions you have or to schedule a consultation please reach out. Don’t be shy, let's get a conversation started!
Reach out directly to Rich Roth @
p: 225.978.1835 e: rich@richroth.net
Follow my adventures on: